Tutorial 1
Exercise 1:
1) 1x1000 + 2x2000 = 5000 dollars
2) 5x400 + 20x200 = 6000 pesos
3) 6000x0,1 = 600 dollars
4) 400x1 + 200x2 = 800: 13% of the US consumption
5) Mexicans have a higher standard of living when looking at their
consumption in PPP. This is because PPP corrects for the fact
that prices are lower in least developed countries. This allows to
better compare economic growth across countries.
Exercise 2:
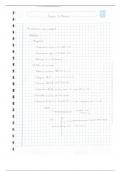
1) As shown in the Graph 1, we can notice that the GDP per capita
for EU converges toward the US from 1960 to 2000 with an
average growth rate of GDP per capita of 3,3% in 60s and 80s,
0.8 percentage point higher than in the US. The EU GDP per
capita represent 62% of the US at the beginning. It reached a
peak in the 80s at 70% of the GDP per capita of the US, then it
continuously decreases to 2000.
2) The post 75 period for EU is marked by similarities with the GDP
per capita of the US. Indeed, the table showed that during the
80s, the GDP per capita for the EU is 2.1% and 2.2 for the US
and during the 90s, it is 1.2% for the EU and 1.1% for the US.
We can talk about convergence during those periods even if
later the GDP per capita decrease for the EU with 0.4%.
3) During this period, the US have a GDP per capita slightly higher
than the EU, there is no point of convergence anymore.
4) During the period 1966-1970, the Graph 2 shows a growth gap
of 1.6 points between US and EU, this number is positive for EU,
they have an advantage over US. Then for the period 1971-
Exercise 1:
1) 1x1000 + 2x2000 = 5000 dollars
2) 5x400 + 20x200 = 6000 pesos
3) 6000x0,1 = 600 dollars
4) 400x1 + 200x2 = 800: 13% of the US consumption
5) Mexicans have a higher standard of living when looking at their
consumption in PPP. This is because PPP corrects for the fact
that prices are lower in least developed countries. This allows to
better compare economic growth across countries.
Exercise 2:
1) As shown in the Graph 1, we can notice that the GDP per capita
for EU converges toward the US from 1960 to 2000 with an
average growth rate of GDP per capita of 3,3% in 60s and 80s,
0.8 percentage point higher than in the US. The EU GDP per
capita represent 62% of the US at the beginning. It reached a
peak in the 80s at 70% of the GDP per capita of the US, then it
continuously decreases to 2000.
2) The post 75 period for EU is marked by similarities with the GDP
per capita of the US. Indeed, the table showed that during the
80s, the GDP per capita for the EU is 2.1% and 2.2 for the US
and during the 90s, it is 1.2% for the EU and 1.1% for the US.
We can talk about convergence during those periods even if
later the GDP per capita decrease for the EU with 0.4%.
3) During this period, the US have a GDP per capita slightly higher
than the EU, there is no point of convergence anymore.
4) During the period 1966-1970, the Graph 2 shows a growth gap
of 1.6 points between US and EU, this number is positive for EU,
they have an advantage over US. Then for the period 1971-