Ans 1)
Indifference Curve:- An indifference curve can be described at a locus of points,
representing a different combination of two commodity but yielding the same level of
u satisfaction. Since each combination of two goods yields the same level of utility, the
consumer is indifferent between any two combinations of goods when it comes to
choosing between them.
A consumer is willing to buy a particular commodity to satisfy his various needs and
wants. Thus, it can be said that the demand for a good is closely related to the level of
satisfaction that the consumer receives from that good. For example, if the level of
consumer satisfaction after consumption of a commodity is high, the demand for that
commodity increases and vice versa.
According to Hicks:- “ It is the locus of the points representing parts of quantities
between which the individual is indifferent and so it is termed as an indifferent curve”.
Such a situation arises because he consumes a large number of goods and services, and
'often' finds that one commodity serves as a substitute for another. This gives him the
opportunity to substitute one item for another and make various combinations of the
two substitutable goods. It may not be possible for him to tell how much utility a
particular combination gives, but it is always possible for him to tell which of the two
combinations is better for him.
It is also possible for him to tell which combinations give him equal satisfaction. Any
combination of consumers is faced equally good combination, that will be indifferent .
When such combinations are plotted graphically, the resulting curve is known as an
indifference curve. The indifference curve is also known the iso-utility curve and equal
utility curve.
Example:- Suppose a consumer consumes only two goods X and Y and makes five
combinations which he calls A, B, C, D, and E. All these combinations give him equal
utility. Its combinations are presented in the table below, which may be called an
indifference schedule – a schedule of different combinations of two goods between
which a consumer is indifferent. The last column of the table shows an undefined utility
(u) obtained from each combination of X and Y.
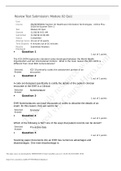
If the combinations a, b, c, d, and e gave in the table below are plotted and added as a
smooth curve, the resulting curve is known as an indifference curve. On this curve, one
can locate a number of other points that show many other combinations of X and Y that
give equal satisfaction..
, Indifference Schedule of Commodities X and Y
Combination Commodity X Commodity Y Utility
a 25 5 U
b 15 7 U
c 10 12 U
d 6 20 U
e 4 30 U
Indifference Curve:- An indifference curve can be described at a locus of points,
representing a different combination of two commodity but yielding the same level of
u satisfaction. Since each combination of two goods yields the same level of utility, the
consumer is indifferent between any two combinations of goods when it comes to
choosing between them.
A consumer is willing to buy a particular commodity to satisfy his various needs and
wants. Thus, it can be said that the demand for a good is closely related to the level of
satisfaction that the consumer receives from that good. For example, if the level of
consumer satisfaction after consumption of a commodity is high, the demand for that
commodity increases and vice versa.
According to Hicks:- “ It is the locus of the points representing parts of quantities
between which the individual is indifferent and so it is termed as an indifferent curve”.
Such a situation arises because he consumes a large number of goods and services, and
'often' finds that one commodity serves as a substitute for another. This gives him the
opportunity to substitute one item for another and make various combinations of the
two substitutable goods. It may not be possible for him to tell how much utility a
particular combination gives, but it is always possible for him to tell which of the two
combinations is better for him.
It is also possible for him to tell which combinations give him equal satisfaction. Any
combination of consumers is faced equally good combination, that will be indifferent .
When such combinations are plotted graphically, the resulting curve is known as an
indifference curve. The indifference curve is also known the iso-utility curve and equal
utility curve.
Example:- Suppose a consumer consumes only two goods X and Y and makes five
combinations which he calls A, B, C, D, and E. All these combinations give him equal
utility. Its combinations are presented in the table below, which may be called an
indifference schedule – a schedule of different combinations of two goods between
which a consumer is indifferent. The last column of the table shows an undefined utility
(u) obtained from each combination of X and Y.
If the combinations a, b, c, d, and e gave in the table below are plotted and added as a
smooth curve, the resulting curve is known as an indifference curve. On this curve, one
can locate a number of other points that show many other combinations of X and Y that
give equal satisfaction..
, Indifference Schedule of Commodities X and Y
Combination Commodity X Commodity Y Utility
a 25 5 U
b 15 7 U
c 10 12 U
d 6 20 U
e 4 30 U