All 5 résultats
Trier par

-
Test Bank for Business Statistics Communicating With Numbers 2nd Edition Jaggia Full Chapter 2024/2025
- Examen • 203 pages • 2024
- €31,70
- + en savoir plus
Test Bank for Business Statistics Communicating With Numbers 2nd Edition Jaggia Full Chapters 2024/2025. The relative frequency of a category is calculated by dividing the category's frequency by the total number of observations. True False 3. The percent frequency of a category equals the frequency of the category multiplied by 100%. True False 4. A pie chart is a segmented circle that portrays the categories and relative sizes of some quantitative variable. True False 5. A bar chart d...

-
Test Bank for Business Statistics Communicating With Numbers 2nd Edition Jaggia Full Chapter 2024/2025
- Examen • 203 pages • 2024
- €28,86
- + en savoir plus
Test Bank for Business Statistics Communicating With Numbers 2nd Edition Jaggia Full Chapterss 2024/2025. The relative frequency of a category is calculated by dividing the category's frequency by the total number of observations. True False 3. The percent frequency of a category equals the frequency of the category multiplied by 100%. True False 4. A pie chart is a segmented circle that portrays the categories and relative sizes of some quantitative variable. True False 5. A bar chart ...

-
Test Bank for Business Statistics Communicating With Numbers 2nd Edition Jaggia Full Chapter | 100% Solved
- Examen • 203 pages • 2024
- €30,75
- + en savoir plus
Test Bank for Business Statistics Communicating With Numbers 2nd Edition Jaggia Full Chapter | 100% Solved. A frequency distribution for qualitative data groups these data into classes called intervals and records the total number of observations in each class. True False 2. The relative frequency of a category is calculated by dividing the category's frequency by the total number of observations. True False 3. The percent frequency of a category equals the frequency of the category multi...

-
Test Bank for Business Statistics Communicating With Numbers 2nd Edition Jaggia Complete Full Chapters | VERIFIED.
- Examen • 203 pages • 2024
- €28,86
- + en savoir plus
A frequency distribution for qualitative data groups these data into classes called intervals and records the total number of observations in each class. True False 2. The relative frequency of a category is calculated by dividing the category's frequency by the total number of observations. True False 3. The percent frequency of a category equals the frequency of the category multiplied by 100%. True False 4. A pie chart is a segmented circle that portrays the categories and relative s...
-
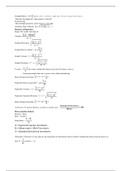
Chapter 3
- Textbook notes • 2 pages • 2018
- €3,30
- + en savoir plus
Chapter 3 Textbook Notes for GB213
