1
Summary Statistics
Discovering Statistics Using IBM SPSS Statistics
Andy Field
Content
Chapter 1................................................................................................................................................2
Chapter 2................................................................................................................................................5
Chapter 5................................................................................................................................................7
Chapter 6................................................................................................................................................8
Chapter 7................................................................................................................................................9
Chapter 8..............................................................................................................................................10
Chapter 9..............................................................................................................................................14
Chapter 10............................................................................................................................................19
Chapter 12............................................................................................................................................23
Chapter 19............................................................................................................................................24
, 2
Chapter 1
Hypothesis: a proposed explanation for a fairly narrow phenomenon or set of observations. A
prediction is derived from the hypothesis.
Falsification: the act of disproving a hypothesis or theory.
Independent variable: a cause predictor variable
Dependent variable: an effect outcome variable
Variables can be split into categorical and continuous, and within these types, there are different
levels of measurement:
1. Categorical (entities are divided into distinct categories):
o Binary variable: there are only two categories (e.g., dead or alive).
o Nominal variable: there are more than two categories (e.g., vegetarian, vegan,
omnivore, etc.).
o Ordinal variable: the same as a nominal variable, but the categories have a logical order
(e.g., fail, pass, merit, distinction on exam).
2. Continuous (entities get a distinct score):
o Interval variable: equal intervals on the variable represent equal differences in the
property being measured (e.g., the difference between 6 and 8 is equivalent to the
difference between 13 and 15).
o Ratio variable: the same as an interval variable, but the ratios of scores on the scale
must also make sense (e.g., a score of 16 on an anxiety scale means that the person is
twice as anxious as someone scoring 8). For this to be true, the scale must have a
meaningful zero point.
Validity: does the instrument measure what it sets out to measure?
Criterion validity: whether you can establish that an instrument measures what it claims to
measure through comparison to objective criteria.
o Concurrent validity: when data are recorded simultaneously using the new instrument
and existing criteria.
o Predictive validity: when data from the new instrument are used to predict
observations at a later point in time.
Content validity: the degree to which individual items represent the construct being
measured.
Reliability: whether an instrument can be interpreted consistently across different situations.
Test-retest reliability: to test the same group of people twice. A reliable instrument will
produce similar scores at both points in time.
There are two ways to manipulate the independent variable:
1. Test different entities (between-groups, between-subjects, or independent design): make
separate groups and use different characteristics.
2. Use the same entities (a within-subject or repeated-measures design): use the same group and
change characteristics over time.
Repeated-measures designs are more sensitive to defect effects than independent designs.
Unsystematic variation: a variation in performance created by unknown factors (such as natural
differences in ability, time of day, etc).
Systematic variation: a variation in performance created by a specific experimental manipulation.
, 3
Randomization: most other causes of systematic variation are eliminated, allowing us to be certain
that any systematic change between experimental conditions is due to independent variable
manipulation.
Practice effects: participants may perform differently in the second condition because of
familiarity with the experimental situation and/or the measures being used.
Boredom effects: participants may perform differently in the second condition because they
are tired or bored from having completed the first condition.
Although these effects are impossible to eliminate completely, we can ensure that they produce no
systematic variation between our conditions by counterbalancing the order in which a person is
participating. This can be done by randomization.
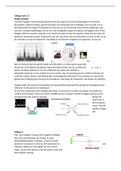
A frequency distribution or histogram is a graph plotting values of observations on the horizontal
axis, with a bar showing how many times each value occurred in the data set. Common types of
distributions:
1. Normal distribution: data is distributed symmetrically around the centre of all scores.
2. Skewed distribution: not symmetrical.
Skewed = lack of symmetry.
a. Positively skewed (high on the left)
b. Negatively skewed (high on the right)
3. Kurtosis = the degree to which scores cluster at the end of the distribution.
a. Leptokurtic distribution = positive kurtosis. Has many scores in the tails (heavy-tailed
distribution).
b. Platykurtic distribution = negative kurtosis. Thin in tails.
c. Mesokurtic = normal distribution.
Summary Statistics
Discovering Statistics Using IBM SPSS Statistics
Andy Field
Content
Chapter 1................................................................................................................................................2
Chapter 2................................................................................................................................................5
Chapter 5................................................................................................................................................7
Chapter 6................................................................................................................................................8
Chapter 7................................................................................................................................................9
Chapter 8..............................................................................................................................................10
Chapter 9..............................................................................................................................................14
Chapter 10............................................................................................................................................19
Chapter 12............................................................................................................................................23
Chapter 19............................................................................................................................................24
, 2
Chapter 1
Hypothesis: a proposed explanation for a fairly narrow phenomenon or set of observations. A
prediction is derived from the hypothesis.
Falsification: the act of disproving a hypothesis or theory.
Independent variable: a cause predictor variable
Dependent variable: an effect outcome variable
Variables can be split into categorical and continuous, and within these types, there are different
levels of measurement:
1. Categorical (entities are divided into distinct categories):
o Binary variable: there are only two categories (e.g., dead or alive).
o Nominal variable: there are more than two categories (e.g., vegetarian, vegan,
omnivore, etc.).
o Ordinal variable: the same as a nominal variable, but the categories have a logical order
(e.g., fail, pass, merit, distinction on exam).
2. Continuous (entities get a distinct score):
o Interval variable: equal intervals on the variable represent equal differences in the
property being measured (e.g., the difference between 6 and 8 is equivalent to the
difference between 13 and 15).
o Ratio variable: the same as an interval variable, but the ratios of scores on the scale
must also make sense (e.g., a score of 16 on an anxiety scale means that the person is
twice as anxious as someone scoring 8). For this to be true, the scale must have a
meaningful zero point.
Validity: does the instrument measure what it sets out to measure?
Criterion validity: whether you can establish that an instrument measures what it claims to
measure through comparison to objective criteria.
o Concurrent validity: when data are recorded simultaneously using the new instrument
and existing criteria.
o Predictive validity: when data from the new instrument are used to predict
observations at a later point in time.
Content validity: the degree to which individual items represent the construct being
measured.
Reliability: whether an instrument can be interpreted consistently across different situations.
Test-retest reliability: to test the same group of people twice. A reliable instrument will
produce similar scores at both points in time.
There are two ways to manipulate the independent variable:
1. Test different entities (between-groups, between-subjects, or independent design): make
separate groups and use different characteristics.
2. Use the same entities (a within-subject or repeated-measures design): use the same group and
change characteristics over time.
Repeated-measures designs are more sensitive to defect effects than independent designs.
Unsystematic variation: a variation in performance created by unknown factors (such as natural
differences in ability, time of day, etc).
Systematic variation: a variation in performance created by a specific experimental manipulation.
, 3
Randomization: most other causes of systematic variation are eliminated, allowing us to be certain
that any systematic change between experimental conditions is due to independent variable
manipulation.
Practice effects: participants may perform differently in the second condition because of
familiarity with the experimental situation and/or the measures being used.
Boredom effects: participants may perform differently in the second condition because they
are tired or bored from having completed the first condition.
Although these effects are impossible to eliminate completely, we can ensure that they produce no
systematic variation between our conditions by counterbalancing the order in which a person is
participating. This can be done by randomization.
A frequency distribution or histogram is a graph plotting values of observations on the horizontal
axis, with a bar showing how many times each value occurred in the data set. Common types of
distributions:
1. Normal distribution: data is distributed symmetrically around the centre of all scores.
2. Skewed distribution: not symmetrical.
Skewed = lack of symmetry.
a. Positively skewed (high on the left)
b. Negatively skewed (high on the right)
3. Kurtosis = the degree to which scores cluster at the end of the distribution.
a. Leptokurtic distribution = positive kurtosis. Has many scores in the tails (heavy-tailed
distribution).
b. Platykurtic distribution = negative kurtosis. Thin in tails.
c. Mesokurtic = normal distribution.