Pack
(28 documents!!!) MATH 225N Week s 5, 6, 7 , & 8 Assignments, Lab Assignments, Exams, Final Exam
MATH 225N Week s 5, 6, 7 , & 8 Assignments, Lab Assignments, Exams, Final Exam
[Montrer plus]MATH 225N Week s 5, 6, 7 , & 8 Assignments, Lab Assignments, Exams, Final Exam
[Montrer plus]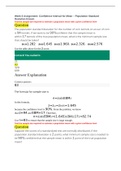
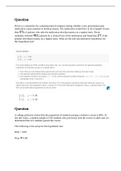
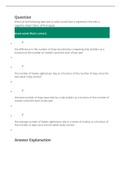
Question The population standard deviation for the number of corn kernels on an ear of corn is 94 kernels. If we want to be 90%confident that the sample mean is within 17 kernels of the true population mean, what is the minimum sample size that should be taken? z0.101.282 z0.051.645 z0.0251.960...
Aperçu 2 sur 12 pages
Ajouter au panierQuestion The population standard deviation for the number of corn kernels on an ear of corn is 94 kernels. If we want to be 90%confident that the sample mean is within 17 kernels of the true population mean, what is the minimum sample size that should be taken? z0.101.282 z0.051.645 z0.0251.960...
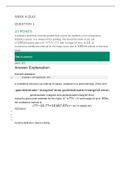
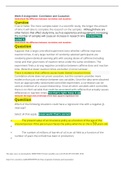
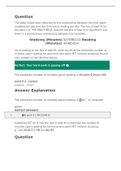
WEEK 6 QUIZ QUESTION 1 · 1/1 POINTS A statistics professor recently graded final exams for students in her introductory statistics course. In a review of her grading, she found the mean score out of points was a x¯=77x¯=77, with a margin of error of 10.10. Construct a confidence interval ...
Aperçu 2 sur 11 pages
Ajouter au panierWEEK 6 QUIZ QUESTION 1 · 1/1 POINTS A statistics professor recently graded final exams for students in her introductory statistics course. In a review of her grading, she found the mean score out of points was a x¯=77x¯=77, with a margin of error of 10.10. Construct a confidence interval ...
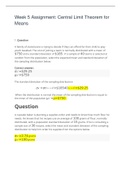
Week 5 Assignment: Central Limit Theorem for Means 1. Question A family of statisticians is trying to decide if they can afford for their child to play youth baseball. The cost of joining a team is normally distributed with a mean of $750 and a standard deviation of $185 . If a sample of 40 tea...
Aperçu 3 sur 17 pages
Ajouter au panierWeek 5 Assignment: Central Limit Theorem for Means 1. Question A family of statisticians is trying to decide if they can afford for their child to play youth baseball. The cost of joining a team is normally distributed with a mean of $750 and a standard deviation of $185 . If a sample of 40 tea...
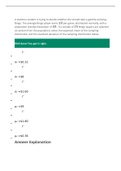
A statistics student is trying to decide whether she should take a gamble and play Bingo. The average Bingo player earns $9 per game, distributed normally, with a population standard deviation of $8 . If a sample of 25 Bingo players are selected at random from the population, select the expected ...
Aperçu 2 sur 14 pages
Ajouter au panierA statistics student is trying to decide whether she should take a gamble and play Bingo. The average Bingo player earns $9 per game, distributed normally, with a population standard deviation of $8 . If a sample of 25 Bingo players are selected at random from the population, select the expected ...
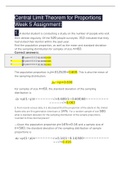
Central Limit Theorem for Proportions Week 5 Assignment: 1. A dental student is conducting a study on the number of people who visit their dentist regularly. Of the 520 people surveyed, 312 indicated that they had visited their dentist within the past year. Find the population proportion, as we...
Aperçu 3 sur 22 pages
Ajouter au panierCentral Limit Theorem for Proportions Week 5 Assignment: 1. A dental student is conducting a study on the number of people who visit their dentist regularly. Of the 520 people surveyed, 312 indicated that they had visited their dentist within the past year. Find the population proportion, as we...
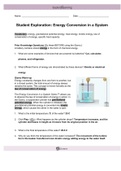
Gizmos : Student Exploration: Energy Conversion in a System - 2020 | NCVPS 03 M11L3M1 Energy Conversion System Gizmo 1 Student Exploration: Energy Conversion in a System Vocabulary: energy, gravitational potential energy, heat energy, kinetic energy, law of conservation of energy, specific heat capa...
Aperçu 2 sur 6 pages
Ajouter au panierGizmos : Student Exploration: Energy Conversion in a System - 2020 | NCVPS 03 M11L3M1 Energy Conversion System Gizmo 1 Student Exploration: Energy Conversion in a System Vocabulary: energy, gravitational potential energy, heat energy, kinetic energy, law of conservation of energy, specific heat capa...
You asked the patient: Is it OK for your mother to be here, while we talk? It was correct to let the patient give his consent for letting his mother be a part of the interview. 1:19 The patient said: I feel bad that I scared my mom.nYou answered: What seemed to lead up to your conflict with your mo...
Aperçu 2 sur 5 pages
Ajouter au panierYou asked the patient: Is it OK for your mother to be here, while we talk? It was correct to let the patient give his consent for letting his mother be a part of the interview. 1:19 The patient said: I feel bad that I scared my mom.nYou answered: What seemed to lead up to your conflict with your mo...
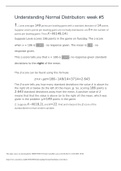
Understanding Normal Distribution: week #5 1. Lexie averages 149 points per bowling game with a standard deviation of 14 points. Suppose Lexie's points per bowling game are normally distributed. Let X= the number of points per bowling game. Then X∼N(149,14). Suppose Lexie scores 186 points in...
Aperçu 2 sur 6 pages
Ajouter au panierUnderstanding Normal Distribution: week #5 1. Lexie averages 149 points per bowling game with a standard deviation of 14 points. Suppose Lexie's points per bowling game are normally distributed. Let X= the number of points per bowling game. Then X∼N(149,14). Suppose Lexie scores 186 points in...
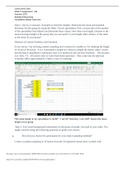
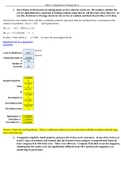
Step 1: Survey or measure 10 people to find their heights. Determine the mean and standard deviation for this group by using the Week 3 Excel spreadsheet. Post a screen shot of the portion of the spreadsheet that helped you determine these values. How does your height compare to the mean (average...
Aperçu 1 sur 4 pages
Ajouter au panierStep 1: Survey or measure 10 people to find their heights. Determine the mean and standard deviation for this group by using the Week 3 Excel spreadsheet. Post a screen shot of the portion of the spreadsheet that helped you determine these values. How does your height compare to the mean (average...
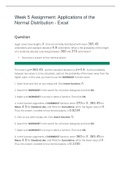
Question Sugar canes have lengths, X , that are normally distributed with mean 365.45 centimeters and standard deviation 4.9 centimeters. What is the probability of the length of a randomly selected cane being between 360 and 370 centimeters? Round your answer to four decimal places. The me...
Aperçu 3 sur 21 pages
Ajouter au panierQuestion Sugar canes have lengths, X , that are normally distributed with mean 365.45 centimeters and standard deviation 4.9 centimeters. What is the probability of the length of a randomly selected cane being between 360 and 370 centimeters? Round your answer to four decimal places. The me...
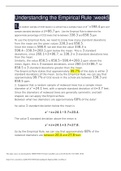
Understanding the Empirical Rule :week5 1. A random sample of CO2 levels in a school has a sample mean of x¯=598.4 ppm and sample standard deviation of s=86.7 ppm. Use the Empirical Rule to determine the approximate percentage of CO2 levels that lie between 338.3 and 858.5 ppm. To use the Empir...
Aperçu 2 sur 6 pages
Ajouter au panierUnderstanding the Empirical Rule :week5 1. A random sample of CO2 levels in a school has a sample mean of x¯=598.4 ppm and sample standard deviation of s=86.7 ppm. Use the Empirical Rule to determine the approximate percentage of CO2 levels that lie between 338.3 and 858.5 ppm. To use the Empir...
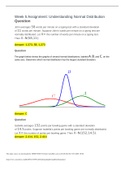
Week 5 Assignment: Understanding Normal Distribution Question John averages 58 words per minute on a typing test with a standard deviation of 11 words per minute. Suppose John's words per minute on a typing test are normally distributed. Let X= the number of words per minute on a typing test. ...
Aperçu 1 sur 4 pages
Ajouter au panierWeek 5 Assignment: Understanding Normal Distribution Question John averages 58 words per minute on a typing test with a standard deviation of 11 words per minute. Suppose John's words per minute on a typing test are normally distributed. Let X= the number of words per minute on a typing test. ...
History of Present Problem • Jan Leisner is a 50-year-old Caucasian woman who has been healthy with no previous medical history. One year ago, she noted a small palpable lump in her right breast about the size of an almond. Because she has been healthy, she assumed it was nothing and ignored ...
Aperçu 3 sur 19 pages
Ajouter au panierHistory of Present Problem • Jan Leisner is a 50-year-old Caucasian woman who has been healthy with no previous medical history. One year ago, she noted a small palpable lump in her right breast about the size of an almond. Because she has been healthy, she assumed it was nothing and ignored ...
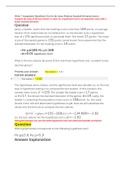
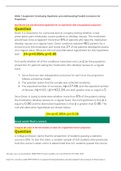
Week 7 Assignment -Conduct a Hypothesis Test for Proportion- P-Value Approach Determine the p-value for a hypothesis test for proportion Question A college administrator claims that the proportion of students that are nursing majors is greater than 40%. To test this claim, a group of 400 student...
Aperçu 2 sur 12 pages
Ajouter au panierWeek 7 Assignment -Conduct a Hypothesis Test for Proportion- P-Value Approach Determine the p-value for a hypothesis test for proportion Question A college administrator claims that the proportion of students that are nursing majors is greater than 40%. To test this claim, a group of 400 student...
Week 7 Hypothesis Testing Q & A 1. Steve listens to his favorite streaming music service when he works out. He wonders whether the service algorithm does a good job of finding random songs that he will like more often than not. To test this, he listens to 50 songs chosen by the service at random ...
Aperçu 4 sur 31 pages
Ajouter au panierWeek 7 Hypothesis Testing Q & A 1. Steve listens to his favorite streaming music service when he works out. He wonders whether the service algorithm does a good job of finding random songs that he will like more often than not. To test this, he listens to 50 songs chosen by the service at random ...
Question: Which type of test is used in the following scenario: The mean cutting rate of two competing table saws is to be compared. Fourteen cuts are randomly selected and measured for cutting speed to test if the speeds were different from each other. Both populations have normal distributions ...
Aperçu 2 sur 13 pages
Ajouter au panierQuestion: Which type of test is used in the following scenario: The mean cutting rate of two competing table saws is to be compared. Fourteen cuts are randomly selected and measured for cutting speed to test if the speeds were different from each other. Both populations have normal distributions ...
Question Devin is a researcher for a pharmaceutical company testing whether a new prescription pain medication causes patients to develop nausea. The medication would have to be scrapped if more than 6% of patients who take the medication develop nausea on a regular basis. Devin randomly selecte...
Aperçu 2 sur 15 pages
Ajouter au panierQuestion Devin is a researcher for a pharmaceutical company testing whether a new prescription pain medication causes patients to develop nausea. The medication would have to be scrapped if more than 6% of patients who take the medication develop nausea on a regular basis. Devin randomly selecte...
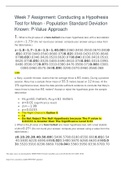
Week 7 Assignment Hypothesis Test for the mean-Polution Standard Deviation known Compute the value of the test statistic (z-value) for a hypothesis test for one population mean with a known standard deviation Question Jamie, a bowler, claims that her bowling score is less than 168 points, on ave...
Aperçu 3 sur 19 pages
Ajouter au panierWeek 7 Assignment Hypothesis Test for the mean-Polution Standard Deviation known Compute the value of the test statistic (z-value) for a hypothesis test for one population mean with a known standard deviation Question Jamie, a bowler, claims that her bowling score is less than 168 points, on ave...
Question Devin is a researcher for a pharmaceutical company testing whether a new prescription pain medication causes patients to develop nausea. The medication would have to be scrapped if more than 6% of patients who take the medication develop nausea on a regular basis. Devin randomly selecte...
Aperçu 2 sur 7 pages
Ajouter au panierQuestion Devin is a researcher for a pharmaceutical company testing whether a new prescription pain medication causes patients to develop nausea. The medication would have to be scrapped if more than 6% of patients who take the medication develop nausea on a regular basis. Devin randomly selecte...
1. What is the p-value of a two-tailed one-mean hypothesis test, with a test statistic of z0=−1.73? (Do not round your answer; compute your answer using a value from the table below.) z−1.8−1.7−1.6−1.5−1.40.000.0360.0450.0550.0670.0810 .010.0350.0440.0540.0660.0790.020.0340.0430.0530...
Aperçu 1 sur 4 pages
Ajouter au panier1. What is the p-value of a two-tailed one-mean hypothesis test, with a test statistic of z0=−1.73? (Do not round your answer; compute your answer using a value from the table below.) z−1.8−1.7−1.6−1.5−1.40.000.0360.0450.0550.0670.0810 .010.0350.0440.0540.0660.0790.020.0340.0430.0530...
MATH 225N Week 7 Lab Assignment (Summer 2020/2021) Complete solution guide - Chamberlain.
Aperçu 1 sur 4 pages
Ajouter au panierMATH 225N Week 7 Lab Assignment (Summer 2020/2021) Complete solution guide - Chamberlain.
MATH 225N Week 8 Assignment Coefficient of Determination A medical experiment on tumor growth gives the following data table……… The least squares regress
Aperçu 1 sur 3 pages
Ajouter au panierMATH 225N Week 8 Assignment Coefficient of Determination A medical experiment on tumor growth gives the following data table……… The least squares regress
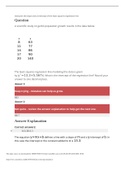
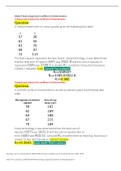
MATH 225N Week 8 Assignment: Correlation Questions-Answers 1. Question: A scientific study on gerbil population growth results in the data below…. The least squares regression line modeling this data is given by yˆ=13.3 5.567x. What is the slope of the regression line? Round your answer to three....
Aperçu 2 sur 7 pages
Ajouter au panierMATH 225N Week 8 Assignment: Correlation Questions-Answers 1. Question: A scientific study on gerbil population growth results in the data below…. The least squares regression line modeling this data is given by yˆ=13.3 5.567x. What is the slope of the regression line? Round your answer to three....
MATH 225N Week 8 Assignment: Correlation and Causation Question: True or False: The more samples taken in a scientific study, the longer the amount of time it will take to complete the research on the samples.Although there are other factors that affect study time, such as experience and equipment,....
Aperçu 1 sur 4 pages
Ajouter au panierMATH 225N Week 8 Assignment: Correlation and Causation Question: True or False: The more samples taken in a scientific study, the longer the amount of time it will take to complete the research on the samples.Although there are other factors that affect study time, such as experience and equipment,....
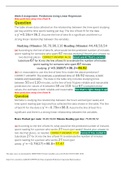
Week 8 Assignment: Predictions Using Linear Regression Make predictions using a line of best fit Question The table shows data collected on the relationship between the time spent studying per day and the time spent reading per day. The line of best fit for the data is yˆ=0.16x+36.2. Assume th...
Aperçu 1 sur 2 pages
Ajouter au panierWeek 8 Assignment: Predictions Using Linear Regression Make predictions using a line of best fit Question The table shows data collected on the relationship between the time spent studying per day and the time spent reading per day. The line of best fit for the data is yˆ=0.16x+36.2. Assume th...
Question Which of the following data sets or plots could have a regression line with a negative slope? Select all that apply. Great work! That's correct. the difference in the number of ships launched by competing ship builders as a function of the number of months since the start of last...
Aperçu 2 sur 11 pages
Ajouter au panierQuestion Which of the following data sets or plots could have a regression line with a negative slope? Select all that apply. Great work! That's correct. the difference in the number of ships launched by competing ship builders as a function of the number of months since the start of last...
MATH 225N Week 8 Discussion: Correlation and Regression, Chamberlain. Initial Post Instructions If a regression analysis was to … completed on body mass index (BMI), what could be an independent variable in that analysis? Why? If we could, what other independent variables should … included in th...
Aperçu 1 sur 1 pages
Ajouter au panierMATH 225N Week 8 Discussion: Correlation and Regression, Chamberlain. Initial Post Instructions If a regression analysis was to … completed on body mass index (BMI), what could be an independent variable in that analysis? Why? If we could, what other independent variables should … included in th...
MATH 225N Week 8 Final Exam (Version 2) Spring 2020 / MATH225N Week 8 Final Exam Spring 2020 complete solutions questions & Answers. The table shows data collected on the relationship between the time spent
Aperçu 3 sur 25 pages
Ajouter au panierMATH 225N Week 8 Final Exam (Version 2) Spring 2020 / MATH225N Week 8 Final Exam Spring 2020 complete solutions questions & Answers. The table shows data collected on the relationship between the time spent

Les clients de Stuvia ont évalués plus de 700 000 résumés. C'est comme ça que vous savez que vous achetez les meilleurs documents.

Vous pouvez payer rapidement avec iDeal, carte de crédit ou Stuvia-crédit pour les résumés. Il n'y a pas d'adhésion nécessaire.

Vos camarades écrivent eux-mêmes les notes d’étude, c’est pourquoi les documents sont toujours fiables et à jour. Cela garantit que vous arrivez rapidement au coeur du matériel.
Vous obtenez un PDF, disponible immédiatement après votre achat. Le document acheté est accessible à tout moment, n'importe où et indéfiniment via votre profil.
Our satisfaction guarantee ensures that you always find a study document that suits you well. You fill out a form, and our customer service team takes care of the rest.
Stuvia est une place de marché. Alors, vous n'achetez donc pas ce document chez nous, mais auprès du vendeur Michael01. Stuvia facilite les paiements au vendeur.
Non, vous n'achetez ce résumé que pour €37,88. Vous n'êtes lié à rien après votre achat.
4.6 étoiles sur Google & Trustpilot (+1000 avis)
88512 résumés ont été vendus ces 30 derniers jours
Fondée en 2010, la référence pour acheter des résumés depuis déjà 14 ans