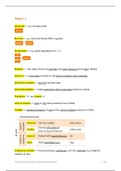
Week 1
Univariate => e.g. average grade
grade
Bivariate => e.g. male and female differ in grades
gender grade
Multivariate => e.g. grade dependent on X, Y, Z
X
Y grade
Z
Statistics => “the study of how we describe and make inferences from data” (Sirkin)
Inference => a conclusion reached on the basis of evidence and reasoning
Descriptive statistics => describe (sample) data
Inferential statistics => make statements about population based on sample
Population ( N ) and sample (n)
Units of analysis => what or who being studied (rows in SPSS)
Variable => measured property of each of the units of analysis (columns in SPSS)
Measurement level
Nominal Can’t be ranked Hair colour
Qualitative
variables
Can be rank-ordered
Ordinal Likert scale
NOIR
(but no equal distances)
Quantitativ
e variables
Interval Ranked with equal distances IQ
Ratio With meaningful zero Age
Continuous variable => measured along a continuum, can have decimals. E.g. height of
students in class.
CM1005 Introduction to Statistical Analysis
,Discrete variable => measured in whole units or categories. E.g. number of students in class.
Measures of central tendency => to (univariately) describe the distribution of variables on
different levels of measurement.
Mean => M =
∑ x or x (used with interval/ratio) = the average (of the sample)
n
Changing any score will change the mean
Adding/removing a score will change the mean (unless the score is already equal to
the mean)
Sum of differences from the mean is zero:
∑ (x−M )=0
Sum of squares (SS) => sum of squared differences from the mean is minimal. Lowest
possible. When using anything other than the mean to calculate SS, the outcome
would be higher.
∑ (x−M )2
∑ x => sum of all x ’s
Population mean => μ=
∑x
N
Median => (used with ordinal and interval/ratio) = 50th percentile = “middle case” when
written down in order.
Median in SPSS frequency table => first category that exceeds 50% in the ‘cumulative
percent’ column.
Outliers => value that sticks out from the rest (way lower/higher).
CM1005 Introduction to Statistical Analysis
,Mode => (used with nominal, ordinal and interval/ratio) the category with the largest
amount of cases.
Mode in SPSS frequency table => category with the highest percentage.
Nominal distributions => symmetric. Mean, median and mode are equal.
Week 2
Dispersion/variability => (spread) mean could be the same. E.g., first group (10 ×20+10 × 60)
has the same mean (40) as the second group (10 ×39+10 × 41).
Range => (ordinal, interval/ratio) distance between the highest and lowest score. Always
report with the maximum and minimum scores. Sensitive to outliers.
Interquartile range (IQR) => (ordinal, interval ratio) based on “quartiles” that split our data
into four equal groups of cases. Q1 (lower quartile), Q2 (median quartile) and Q3 (upper
quartile).
IQR=Q3 −Q1
Variance => (interval/ratio) based on Sum of Squares. Different for sample and population
data (sample is more common).
2 ∑ (x−M )2 2 ∑ (x−μ)
2
s= (sample) σ = (population)
n−1 N
Higher variance => more data difference.
n−1 => unbiased estimator
2 SS
Definitional variance => s = , where SS=∑ ( x−M )2
n−1
CM1005 Introduction to Statistical Analysis
, 2
SS ( x)
, where SS=∑ x2 − ∑
2
Computational variance => s = . No need to calculate
n−1 n
individual distances from the mean.
Standard deviation (SD) => (interval/ratio) approximate measure of the average distance to
the mean. It is the square root of the variance.
∑ ( x−M )2 (sample) ∑ ( x−μ)2 (population)
s=
√ n−1
σ=
√ N
Independent variable ( x ) => variable with values that are taken as simply given.
Dependent variable ( y ) => variable assumed to depend on, or be caused by, another (the
independent) variable.
Normally distributed variables. E.g. mean = 12 and SD = 4.
3 preconditions for making causal claims
1. Empirical evidence → for a relationship between the variables.
2. Temporal sequence → x occurs before the change or effect of y occurs.
3. Causality claim should be supported by reason and theory.
Confound variable => An unanticipated variable not accounted for in a research that could
be causing or associated with observed changes in one or more measured variables. E.g., in
a relation between feet size and reading skills, the confound variable is age.
Reverse causality => a problem that arises when the direction of causality between two
factors can be either direction.
Scatterplot => allows for graphical representation of the relationship between two
(interval/ratio) variables. Scatterplot’s x -axis is mostly for the independent variable.
CM1005 Introduction to Statistical Analysis
Univariate => e.g. average grade
grade
Bivariate => e.g. male and female differ in grades
gender grade
Multivariate => e.g. grade dependent on X, Y, Z
X
Y grade
Z
Statistics => “the study of how we describe and make inferences from data” (Sirkin)
Inference => a conclusion reached on the basis of evidence and reasoning
Descriptive statistics => describe (sample) data
Inferential statistics => make statements about population based on sample
Population ( N ) and sample (n)
Units of analysis => what or who being studied (rows in SPSS)
Variable => measured property of each of the units of analysis (columns in SPSS)
Measurement level
Nominal Can’t be ranked Hair colour
Qualitative
variables
Can be rank-ordered
Ordinal Likert scale
NOIR
(but no equal distances)
Quantitativ
e variables
Interval Ranked with equal distances IQ
Ratio With meaningful zero Age
Continuous variable => measured along a continuum, can have decimals. E.g. height of
students in class.
CM1005 Introduction to Statistical Analysis
,Discrete variable => measured in whole units or categories. E.g. number of students in class.
Measures of central tendency => to (univariately) describe the distribution of variables on
different levels of measurement.
Mean => M =
∑ x or x (used with interval/ratio) = the average (of the sample)
n
Changing any score will change the mean
Adding/removing a score will change the mean (unless the score is already equal to
the mean)
Sum of differences from the mean is zero:
∑ (x−M )=0
Sum of squares (SS) => sum of squared differences from the mean is minimal. Lowest
possible. When using anything other than the mean to calculate SS, the outcome
would be higher.
∑ (x−M )2
∑ x => sum of all x ’s
Population mean => μ=
∑x
N
Median => (used with ordinal and interval/ratio) = 50th percentile = “middle case” when
written down in order.
Median in SPSS frequency table => first category that exceeds 50% in the ‘cumulative
percent’ column.
Outliers => value that sticks out from the rest (way lower/higher).
CM1005 Introduction to Statistical Analysis
,Mode => (used with nominal, ordinal and interval/ratio) the category with the largest
amount of cases.
Mode in SPSS frequency table => category with the highest percentage.
Nominal distributions => symmetric. Mean, median and mode are equal.
Week 2
Dispersion/variability => (spread) mean could be the same. E.g., first group (10 ×20+10 × 60)
has the same mean (40) as the second group (10 ×39+10 × 41).
Range => (ordinal, interval/ratio) distance between the highest and lowest score. Always
report with the maximum and minimum scores. Sensitive to outliers.
Interquartile range (IQR) => (ordinal, interval ratio) based on “quartiles” that split our data
into four equal groups of cases. Q1 (lower quartile), Q2 (median quartile) and Q3 (upper
quartile).
IQR=Q3 −Q1
Variance => (interval/ratio) based on Sum of Squares. Different for sample and population
data (sample is more common).
2 ∑ (x−M )2 2 ∑ (x−μ)
2
s= (sample) σ = (population)
n−1 N
Higher variance => more data difference.
n−1 => unbiased estimator
2 SS
Definitional variance => s = , where SS=∑ ( x−M )2
n−1
CM1005 Introduction to Statistical Analysis
, 2
SS ( x)
, where SS=∑ x2 − ∑
2
Computational variance => s = . No need to calculate
n−1 n
individual distances from the mean.
Standard deviation (SD) => (interval/ratio) approximate measure of the average distance to
the mean. It is the square root of the variance.
∑ ( x−M )2 (sample) ∑ ( x−μ)2 (population)
s=
√ n−1
σ=
√ N
Independent variable ( x ) => variable with values that are taken as simply given.
Dependent variable ( y ) => variable assumed to depend on, or be caused by, another (the
independent) variable.
Normally distributed variables. E.g. mean = 12 and SD = 4.
3 preconditions for making causal claims
1. Empirical evidence → for a relationship between the variables.
2. Temporal sequence → x occurs before the change or effect of y occurs.
3. Causality claim should be supported by reason and theory.
Confound variable => An unanticipated variable not accounted for in a research that could
be causing or associated with observed changes in one or more measured variables. E.g., in
a relation between feet size and reading skills, the confound variable is age.
Reverse causality => a problem that arises when the direction of causality between two
factors can be either direction.
Scatterplot => allows for graphical representation of the relationship between two
(interval/ratio) variables. Scatterplot’s x -axis is mostly for the independent variable.
CM1005 Introduction to Statistical Analysis