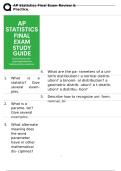
AP Statistics Final Exam Review &
Practice.
4. What are the pa- rameters of a uni-
form distribution? a normal distrib-
1. What is a
ution? a binomi- al distribution? a
statistic? Give
geometric distrib- ution? a t distrib-
several exam-
ution? a distribu- tion?
ples.
5. Describe how to recognize uni- form,
normal, bi-
2. What is a
parame- ter?
Give several
examples.
3. What alternate
meaning does
the word
parameter
have in other
mathematical
dis- ciplines?
1/
49
, AP Statistics Final Exam Review &
Practice.
A x.
A related example of a sample would be a group of 7th graders in the
n United States
u
m A number that describes a
b population. Ex.
e An example of a population is all 7th graders in the United States.
r
An "adjustable constant" that defines the nature of a mathematical
model, much as a tuning knob or volume slider adjusts the output of
c
a television or radio.
o
m
p
u
t
e Uniform: min and max [also need to know whether distrib. is discrete
d or continuous]
Normal: and
f Binomial: n and p
r Geometric: p
o t: df
m : df
d
a
t
a Uniform: flat line in relative frequency histogram
. Normal: classic continuous bell-shaped curve, satisfies 68-95-99.7
rule Binomial: discrete ("stairsteppy"); skew right if p < .5, skew left if
E p > .5,
nomial, geometric, symmetric if p = q = .5
Geometric: discrete ("stairsteppy"), always skew right
2/
49
, AP Statistics Final Exam Review &
Practice.
t, and t: continuous, bell-shaped; virtually normal for large df, except with
distribu- more "flab" in the tails
tions. : continuous, always skew right
Range is a single number for the spread of values in a column of
6. Define range data: range = max - min. People who say things like "the range is
and describe from 28 to 75" are misusing the term in its statistical sense.
how to find it.
7. Define IQR and de- IQR (interquartile range) = Q3 - Q1. Use STAT CALC 1 to get 5-
number summary,
scribe how to find variance?
it.
11. What does s.d. measure, and how is it
8. Describe how computed?
to find
outliers
(a)
in a column of
data;
(b)
in a regression
setting.
9. In regression,
what names
are given to the
x and y
variables?
10. What does MSE
mean? Is it a
syn- onym for
3/
49
, AP Statistics Final Exam Review &
Practice.
en
RS 5 PTS 9 - VARS 5 PTS 7.
)
Easiest way is to make
modified boxplot, then TRACE
to see the points (use arrow
keys). Outliers are more than
1.5IQR below Q1 or more than
1.5IQR above Q3.
)
o rule of thumb—just judge
visually. Outliers have "large"
residuals.
planatory, response.
ean squared error = pop. variance
(mean squared deviation from
the mean). Sample variance is
ditterent, since denom. is n - 1
instead of n.
p. s.d. ( ) and sample s.d. (s) are
measures of data dispersion
("spread"). Use STAT CALC 1 to
compute, never the formula on
AP formula sheet. Technically,
4/
49
Practice.
4. What are the pa- rameters of a uni-
form distribution? a normal distrib-
1. What is a
ution? a binomi- al distribution? a
statistic? Give
geometric distrib- ution? a t distrib-
several exam-
ution? a distribu- tion?
ples.
5. Describe how to recognize uni- form,
normal, bi-
2. What is a
parame- ter?
Give several
examples.
3. What alternate
meaning does
the word
parameter
have in other
mathematical
dis- ciplines?
1/
49
, AP Statistics Final Exam Review &
Practice.
A x.
A related example of a sample would be a group of 7th graders in the
n United States
u
m A number that describes a
b population. Ex.
e An example of a population is all 7th graders in the United States.
r
An "adjustable constant" that defines the nature of a mathematical
model, much as a tuning knob or volume slider adjusts the output of
c
a television or radio.
o
m
p
u
t
e Uniform: min and max [also need to know whether distrib. is discrete
d or continuous]
Normal: and
f Binomial: n and p
r Geometric: p
o t: df
m : df
d
a
t
a Uniform: flat line in relative frequency histogram
. Normal: classic continuous bell-shaped curve, satisfies 68-95-99.7
rule Binomial: discrete ("stairsteppy"); skew right if p < .5, skew left if
E p > .5,
nomial, geometric, symmetric if p = q = .5
Geometric: discrete ("stairsteppy"), always skew right
2/
49
, AP Statistics Final Exam Review &
Practice.
t, and t: continuous, bell-shaped; virtually normal for large df, except with
distribu- more "flab" in the tails
tions. : continuous, always skew right
Range is a single number for the spread of values in a column of
6. Define range data: range = max - min. People who say things like "the range is
and describe from 28 to 75" are misusing the term in its statistical sense.
how to find it.
7. Define IQR and de- IQR (interquartile range) = Q3 - Q1. Use STAT CALC 1 to get 5-
number summary,
scribe how to find variance?
it.
11. What does s.d. measure, and how is it
8. Describe how computed?
to find
outliers
(a)
in a column of
data;
(b)
in a regression
setting.
9. In regression,
what names
are given to the
x and y
variables?
10. What does MSE
mean? Is it a
syn- onym for
3/
49
, AP Statistics Final Exam Review &
Practice.
en
RS 5 PTS 9 - VARS 5 PTS 7.
)
Easiest way is to make
modified boxplot, then TRACE
to see the points (use arrow
keys). Outliers are more than
1.5IQR below Q1 or more than
1.5IQR above Q3.
)
o rule of thumb—just judge
visually. Outliers have "large"
residuals.
planatory, response.
ean squared error = pop. variance
(mean squared deviation from
the mean). Sample variance is
ditterent, since denom. is n - 1
instead of n.
p. s.d. ( ) and sample s.d. (s) are
measures of data dispersion
("spread"). Use STAT CALC 1 to
compute, never the formula on
AP formula sheet. Technically,
4/
49