
PE Exam - Traffic Engineering
PE Exam - Traffic Engineering-2025
Study online at https://quizlet.com/_gf1ys7
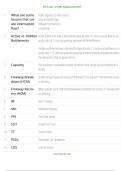
1. What are some Traffic signals (<2 miles apart)
factors that cre- Stop and yield signs
ate interrupted Frequent intersections
flow? Congestion
2. Active vs. Hidden Active bottlenecks have a demand-to-capacity ratio >1, and an actual flow-to-ca-
Bottlenecks pacity ratio of 1, causing queuing upstream of the bottleneck.
Hidden bottlenecks have a demand-to-capacity ratio > 1, and an actual flow-to-ca-
pacity ratio <= 1, with no upstream queuing. Another bottleneck upstream meters
the demand so that no queue forms.
3. Capacity The maximum sustainable number of vehicles that can be accommodated on a
facility
4. Freeway Break- Sudden drop of speed of at least 25% below FFS for at least 15 minutes that results
down (HCM) in queuing
5. Freeway Recov- When speeds reach 10% of prebreakdown conditions for at least 15 minutes with
ery (HCM) no queuing
6. BF Basic Freeway
7. MH Multilane Highway
8. FFS Free Flow Speed
9. SUT Single-Unit Truck
10. TT Tractor Trailer
11. PCEs Passenger Car Equivalents
12. LOS Level of Service
www.stuvia.com
, PE Exam - Traffic Engineering
PE Exam - Traffic Engineering-2025
Study online at https://quizlet.com/_gf1ys7
13. 4 Base Condi- No heavy vehicles
tions of BF&MH Regular users
Segments 12' lanes
Adequate lateral clearance
Also include good weather, visibility, pavement conditions, and no work zones,
accidents, or incidents
14. Basic Freeway Limited access (at interchanges)
Characteristics Higher speeds (50-75 mph)
Divided highways
Grade separated intersections
Always divided
2+ lanes in each direction
15. Multilane High- Greater access (e.g. from drives, intersections, or interchanges)
way Characteris- Lower speeds (40-65 mph)
tics Divided, undivided, or TWLTL
16. Undersaturated Traffic is not affected by upstream or downstream bottlenecks
Flow A desirable condition
17. Queue Discharge Traffic just passed a bottleneck and is regaining speed
Flow
18. Oversaturated Traffic is congested or queued due to a downstream bottleneck
Flow
19. Speed-Flow Constant speed range - FFS until flow reaches a Break Point (BP)
Curve (for BF and Decreasing speed range - Decreasing speed from BP flow until capacity (c)
MH) Capacity - Speed and flow drop to 0, when density is 45 pc/mi/ln
20. 85th Percentile Speed at which 85% of drivers drive at or below, often set as the highway speed
Speed
www.stuvia.com
, PE Exam - Traffic Engineering
PE Exam - Traffic Engineering-2025
Study online at https://quizlet.com/_gf1ys7
21. How to deter- Upper limit of the 10 mph pace - a horizontal line with length of 10 mph that
mine the 85th connects the left and right sides of the curve.
percentile speed
from a speed dis- 1 standard deviation above the mean (~84%)
tribution curve?
22. LOS E 45 pc/mi/ln
23. LOS F Demand exceeds capacity
24. Three Types of Basic Segment
Freeway Seg- Weaving Segment
ments Merge/Diverge Segment (ramps)
25. What are the 1. Review given info
steps to ana- 2. Measure or Estimate/adjust FFS
lyze uninterrupt- 3. Estimate and adjust capacity, c
ed flow on 4. Adjust demand volume, v_p and check for LOS F
BF&MH? 5. Estimate speed, S and density, D
6. Determine LOS
26. FFS The free flow speed is the average travel time of passenger cars during low to
moderate flow, usually not given on PE exam and must be calculated.
27. BFFS (Basic Free- Base Free Flow Speed for a Basic Freeway, use 75.4 if not given
ways)
28. BFFS (Multilane Base Free Flow Speed for a Multilane Highway, use Speed Limit + 5 (over 50 mph)
Highways) or Speed Limit + 7 (under 50 mph) if not given
29. TLC Total Lateral Clearance = Left Side Lateral Clearance + Right Side Lateral Clearance,
max 6' on for a side
30. c Capacity (pc/hr/ln)
www.stuvia.com
PE Exam - Traffic Engineering-2025
Study online at https://quizlet.com/_gf1ys7
1. What are some Traffic signals (<2 miles apart)
factors that cre- Stop and yield signs
ate interrupted Frequent intersections
flow? Congestion
2. Active vs. Hidden Active bottlenecks have a demand-to-capacity ratio >1, and an actual flow-to-ca-
Bottlenecks pacity ratio of 1, causing queuing upstream of the bottleneck.
Hidden bottlenecks have a demand-to-capacity ratio > 1, and an actual flow-to-ca-
pacity ratio <= 1, with no upstream queuing. Another bottleneck upstream meters
the demand so that no queue forms.
3. Capacity The maximum sustainable number of vehicles that can be accommodated on a
facility
4. Freeway Break- Sudden drop of speed of at least 25% below FFS for at least 15 minutes that results
down (HCM) in queuing
5. Freeway Recov- When speeds reach 10% of prebreakdown conditions for at least 15 minutes with
ery (HCM) no queuing
6. BF Basic Freeway
7. MH Multilane Highway
8. FFS Free Flow Speed
9. SUT Single-Unit Truck
10. TT Tractor Trailer
11. PCEs Passenger Car Equivalents
12. LOS Level of Service
www.stuvia.com
, PE Exam - Traffic Engineering
PE Exam - Traffic Engineering-2025
Study online at https://quizlet.com/_gf1ys7
13. 4 Base Condi- No heavy vehicles
tions of BF&MH Regular users
Segments 12' lanes
Adequate lateral clearance
Also include good weather, visibility, pavement conditions, and no work zones,
accidents, or incidents
14. Basic Freeway Limited access (at interchanges)
Characteristics Higher speeds (50-75 mph)
Divided highways
Grade separated intersections
Always divided
2+ lanes in each direction
15. Multilane High- Greater access (e.g. from drives, intersections, or interchanges)
way Characteris- Lower speeds (40-65 mph)
tics Divided, undivided, or TWLTL
16. Undersaturated Traffic is not affected by upstream or downstream bottlenecks
Flow A desirable condition
17. Queue Discharge Traffic just passed a bottleneck and is regaining speed
Flow
18. Oversaturated Traffic is congested or queued due to a downstream bottleneck
Flow
19. Speed-Flow Constant speed range - FFS until flow reaches a Break Point (BP)
Curve (for BF and Decreasing speed range - Decreasing speed from BP flow until capacity (c)
MH) Capacity - Speed and flow drop to 0, when density is 45 pc/mi/ln
20. 85th Percentile Speed at which 85% of drivers drive at or below, often set as the highway speed
Speed
www.stuvia.com
, PE Exam - Traffic Engineering
PE Exam - Traffic Engineering-2025
Study online at https://quizlet.com/_gf1ys7
21. How to deter- Upper limit of the 10 mph pace - a horizontal line with length of 10 mph that
mine the 85th connects the left and right sides of the curve.
percentile speed
from a speed dis- 1 standard deviation above the mean (~84%)
tribution curve?
22. LOS E 45 pc/mi/ln
23. LOS F Demand exceeds capacity
24. Three Types of Basic Segment
Freeway Seg- Weaving Segment
ments Merge/Diverge Segment (ramps)
25. What are the 1. Review given info
steps to ana- 2. Measure or Estimate/adjust FFS
lyze uninterrupt- 3. Estimate and adjust capacity, c
ed flow on 4. Adjust demand volume, v_p and check for LOS F
BF&MH? 5. Estimate speed, S and density, D
6. Determine LOS
26. FFS The free flow speed is the average travel time of passenger cars during low to
moderate flow, usually not given on PE exam and must be calculated.
27. BFFS (Basic Free- Base Free Flow Speed for a Basic Freeway, use 75.4 if not given
ways)
28. BFFS (Multilane Base Free Flow Speed for a Multilane Highway, use Speed Limit + 5 (over 50 mph)
Highways) or Speed Limit + 7 (under 50 mph) if not given
29. TLC Total Lateral Clearance = Left Side Lateral Clearance + Right Side Lateral Clearance,
max 6' on for a side
30. c Capacity (pc/hr/ln)
www.stuvia.com

