Step by step Manual
Mixed ANOVA
Within-subject: one participant sees all conditions
Between-subject: one participant sees only one condition
1. Check the normality
1. Between-subject factor: normality of individual conditions
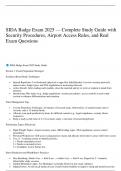
1. Analyze > Descriptive Statistics > Explore
1. DV in dependent
2. IV in factor list
2. Also check homogeneity (Levene’s test)
2. Within-subject factor: normality of the difference between conditions
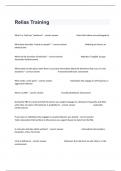
1. Transform > Compute variable
1. Create a variable (d1) for a difference between var1 and var 2 (var1 - var2)
2. Do this per combination
2. Check skewness of kurtosis OR use Kolmogorov-Smirnov;
1. Analyze > Descriptive Statistics > Explore
2. Drag all difference variables in ‘dependent list’
3. Plots > check Normality plots with tests
4. Output: check KS-test values. When < .05, assumption is not met.
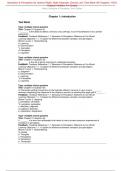
2. Analyze > Descriptives > Explore
1. Put within-subject var (each seperate condition/level) in Dependent List
2. Put between-subject var in Factor List
3. Plots > Normality plots with tests & Untransformed Levene Test & Histogram
4. Output
1. Tests of Normality
1. If the test is significant (< .05), the assumption is not met.
2. What to do if assumption is not met?
1. Look at the normal Q-Q plot > if it doesn’t look very bad, it is still ok
2. Look at the histogram > if it looks ok, it’s still ok
3. Chapter 6 of book for other things to do if you have serious problems with
normality of your data (e.g. trimming data, transforming data)
2. Test of Homogeneity of Variances (only for between-subject factors)
1. Read Based on Median
2. If test is significant, assumption is not met
1. What to do > trim or transform data (ch6). Or if its e.g. 1 out of 6, just
interpret and report but with more caution.
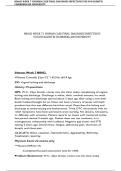
3. Analyze > General Linear Model > Repeated Measures
1. Define your IVs yourself
1. Define name of var
2. Define number of levels
3. Add & repeat for other variable
2. Enter conditions into Within-Subjects Variables (name&label moeten overeenkomen)
3. Enter between-subject variable in between-subject factors
4. Options > select:
1. Descriptive statistics
2. Estimates of effect size
Mixed ANOVA
Within-subject: one participant sees all conditions
Between-subject: one participant sees only one condition
1. Check the normality
1. Between-subject factor: normality of individual conditions
1. Analyze > Descriptive Statistics > Explore
1. DV in dependent
2. IV in factor list
2. Also check homogeneity (Levene’s test)
2. Within-subject factor: normality of the difference between conditions
1. Transform > Compute variable
1. Create a variable (d1) for a difference between var1 and var 2 (var1 - var2)
2. Do this per combination
2. Check skewness of kurtosis OR use Kolmogorov-Smirnov;
1. Analyze > Descriptive Statistics > Explore
2. Drag all difference variables in ‘dependent list’
3. Plots > check Normality plots with tests
4. Output: check KS-test values. When < .05, assumption is not met.
2. Analyze > Descriptives > Explore
1. Put within-subject var (each seperate condition/level) in Dependent List
2. Put between-subject var in Factor List
3. Plots > Normality plots with tests & Untransformed Levene Test & Histogram
4. Output
1. Tests of Normality
1. If the test is significant (< .05), the assumption is not met.
2. What to do if assumption is not met?
1. Look at the normal Q-Q plot > if it doesn’t look very bad, it is still ok
2. Look at the histogram > if it looks ok, it’s still ok
3. Chapter 6 of book for other things to do if you have serious problems with
normality of your data (e.g. trimming data, transforming data)
2. Test of Homogeneity of Variances (only for between-subject factors)
1. Read Based on Median
2. If test is significant, assumption is not met
1. What to do > trim or transform data (ch6). Or if its e.g. 1 out of 6, just
interpret and report but with more caution.
3. Analyze > General Linear Model > Repeated Measures
1. Define your IVs yourself
1. Define name of var
2. Define number of levels
3. Add & repeat for other variable
2. Enter conditions into Within-Subjects Variables (name&label moeten overeenkomen)
3. Enter between-subject variable in between-subject factors
4. Options > select:
1. Descriptive statistics
2. Estimates of effect size