

Escrito por estudiantes que aprobaron Inmediatamente disponible después del pago Leer en línea o como PDF ¿Documento equivocado? Cámbialo gratis 4,6 TrustPilot
logo-home
Document preview thumbnail
Vista previa 2 fuera de 5 páginas
Examen

NSG 481: Biostatistics and Applied Epidemiology Quiz 1_ Complete Questions and Answers.

Document preview thumbnail
Vista previa 2 fuera de 5 páginas

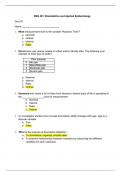
NSG 481: Biostatistics and Applied Epidemiology Quiz #1 Name: 1. What measurement level is the variable “Reaction Time”? a. Nominal b. Ordinal c. Interval d. Ratio 2. Statisticians use various scales to collect and/or identify data. The following is an example of what type of scale? Pain Intensity 0 No pain 1 Minor/little pain 2 Moderate pain 3 Severe pain a. Nominal b. Interval c. Ratio d. Ordinal 3. Someone who ranks a list of cities from slowest to fastest pace of life is operating at the level of measurement. a. Nominal b. Interval c. Ratio d. Ordinal 4. An investigator studies how concept-formulation ability changes with age. Age is a discrete variable. a. True b. False 5. What is the purpose of descriptive statistics? a. To summarize, organize, simplify data. b. To examine relationships between variables by measuring two different variables for each individual. c. To report the discrepancy or amount of error exists between a sample statistic and the corresponding population parameter. d. To report a characteristic or condition that changes or has different values for different individuals 6. Central Tendency refers to: a. An organized tabulation of number of individuals located in each categories on the scale of measurement b. A measurement or observation c. A numerical value that describes a sample d. A statistical measure to determine a single score that defines the center of a distribution 7. Which of the following is not a measure of central tendency? a. Mean b. Median c. Mode d. Standard deviation 8. Which measure of central tendency will be most affected if one extremely large score is added to a distribution? a. Mean b. Median c. Mode d. Standard deviation 9. In the below distribution of scores, what is the mean? X f 12 3 11 0 10 1 9 1 8 1 7 1 a. 12 b. 10 (70/7=10) c. 11.5 d. 13.5 10. The median is represented by which score? X f 12 3 11 0 10 1 9 1 8 1 7 1 a. 12 b. 10 c. 9 d. 9 11. Symmetrical distributions are the best described by which of the following statements? a. They have equal number of data points that appear to the left and to the right of the center b. They have a U-shaped distribution-Bell shape c. They tend to pile up toward one of end of the scale and taper off gradually at the other end. d. All of the above 12. The direction of skewness is determined by the relative position of the: a. Peak of the distribution b. Midpoint of the distribution c. Tail of the distribution d. Class limits of the distribution 13. Three measures of variability include the following a. Mean, medina, and mode b. Mean, standard deviation, and data c. Range, variance, and standard deviation d. Mode, range, standard deviation 14. Standard deviation refers to a. The average difference between the mean and each of the scores in the data set b. A difference score based on the lowest and highest value in the set c. Scores that have been standardized to have a mean of zero d. Grouping scores so as that the range in each set is standardized and equal 15. Which of the following statements best describes variance: a. A measure of the spread of the recorded values on a variable b. The larger the variance, the further the individual cases are from the mean c. The most commonly used measure of variability d. All of the above 16. Which measure of central tendency represents the point of maximum frequency in a distribution? a. Mode b. Median c. Mean d. None of the above 17. The variance and standard deviation assume: a. Nominal data b. Ordinal data c. Interval/ratio data d. A normal distribution 18. Calculate the SS (Sum of squares) for this table using the formula (SS=∑ X2 - [(∑ (∑ X )2 ∑ X 2− 19. Calculate the sample (not population) variance for above table using the formula s2= SS n−1 . 20. Calculate the standard deviation of the sample (not population) of scores in the s =√ SS Wegesin and Stern (2004) found greater consistency (less variability) in the memory performance scores for younger women than for older women. The following data represent memory scores obtained for two women, one older and one younger, over a series of memory trials. Calculate the variance of the sample (not for population) for each women using the formula SS=∑ X2 - [(∑ X)2/n] . 21. Younger: 8, 6, 6, 7, 8, 7, 8, 8 Sample; SS =5.58 22. Older: 7 ,5 8 ,5 ,7 ,6, 8, 5 23. Are the scores for the younger woman more consistent (less variable?)

Vista previa del contenido

NSG 481: Biostatistics and Applied Epidemiology

Quiz #1

Name:

1. What measurement level is the variable “Reaction Time”?
a. Nominal
b. Ordinal
c. Interval
d. Ratio

2. Statisticians use various scales to collect and/or identify data. The following is an
example of what type of scale?

Pain Intensity
0 No pain
1 Minor/little pain
2 Moderate pain
3 Severe pain

a. Nominal
b. Interval
c. Ratio
d. Ordinal

3. Someone who ranks a list of cities from slowest to fastest pace of life is operating at
the level of measurement.
a. Nominal
b. Interval
c. Ratio
d. Ordinal

4. An investigator studies how concept-formulation ability changes with age. Age is a
discrete variable.
a. True
b. False

5. What is the purpose of descriptive statistics?
a. To summarize, organize, simplify data.
b. To examine relationships between variables by measuring two different
variables for each individual.

, c. To report the discrepancy or amount of error exists between a sample statistic
and the corresponding population parameter.
d. To report a characteristic or condition that changes or has different values for
different individuals

6. Central Tendency refers to:
a. An organized tabulation of number of individuals located in each categories
on the scale of measurement
b. A measurement or observation
c. A numerical value that describes a sample
d. A statistical measure to determine a single score that defines the center of a
distribution

7. Which of the following is not a measure of central tendency?
a. Mean
b. Median
c. Mode
d. Standard deviation

8. Which measure of central tendency will be most affected if one extremely large score
is added to a distribution?

a. Mean
b. Median
c. Mode
d. Standard deviation

9. In the below distribution of scores, what is the mean?
X f
12 3
11 0
10 1
9 1
8 1
7 1
a. 12
b. 10 (70/7=10)
c. 11.5
d. 13.5

10. The median is represented by which score?
X f
12 3

Información del documento

Subido en
7 de julio de 2025
Número de páginas
5
Escrito en
2024/2025
Tipo
Examen
Contiene
Preguntas y respuestas
$13.99

¿Documento equivocado? Cámbialo gratis Dentro de los 14 días posteriores a la compra y antes de descargarlo, puedes elegir otro documento. Puedes gastar el importe de nuevo.
Escrito por estudiantes que aprobaron
Inmediatamente disponible después del pago
Leer en línea o como PDF

Seller avatar
Los indicadores de reputación están sujetos a la cantidad de artículos vendidos por una tarifa y las reseñas que ha recibido por esos documentos. Hay tres niveles: Bronce, Plata y Oro. Cuanto mayor reputación, más podrás confiar en la calidad del trabajo del vendedor.
MindCraft
3.8
(49)
Vendido
387
Seguidores
10
Artículos
2834
Última venta
5 horas hace


Por qué los estudiantes eligen Stuvia

Creado por compañeros estudiantes, verificado por reseñas

Calidad en la que puedes confiar: escrito por estudiantes que aprobaron y evaluado por otros que han usado estos resúmenes.

¿No estás satisfecho? Elige otro documento

¡No te preocupes! Puedes elegir directamente otro documento que se ajuste mejor a lo que buscas.

Paga como quieras, empieza a estudiar al instante

Sin suscripción, sin compromisos. Paga como estés acostumbrado con tarjeta de crédito y descarga tu documento PDF inmediatamente.

Student with book image

“Comprado, descargado y aprobado. Así de fácil puede ser.”

Alisha Student

Preguntas frecuentes