
STATISTICS
— science of collecting, organizing, and interpreting numerical facts (i.e. data)
Statistics consists of a body of methods for obtaining and analyzing data, to:
1. Design (research studies)
2. Describe (the data)
3. Make inferences (based on these data)
1. Descriptive: summarises sample or population data with numbers, tables, and graphs
2. Inferential: generates predictions about population parameters, based on sample data
Statistical literacy
— ability to understand and critically evaluate statistical results that permeate our lives;
Coupled with ability to appreciate contributions that statistical thinking can make in
public and private, professional and personal decisions
Probability applies deduction; if we know the details of a certain population, how likely is a
certain outcome? (i.e. general → specific) → given model, predict data
Statistics apply induction; given a certain sample outcome, what can we say about the
population, and with what probability? (i.e specific → general) → given data, predict model
VARIABLES
– anything that is being measured, questioned, or kept a record of in research
Types of Variables
● Behavioral
● Stimulus
● Subject
● Physiological
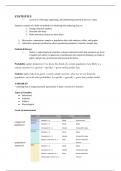
Levels of measurement
categorical/
Qualitative
quantitative/
numerical
,Value Range
● Discrete: measure unit is indivisible (eg number of siblings)
● Continuous: unit is infinitely divisible (eg height)
POPULATION & SAMPLE
– population: entire interest group of individuals (parameter)
- Greek letters used to represent data about population
- Population mean: μ
- Population standard deviation: α
– sample: a subset of the population. Based on the sample, a claim is made about the population
(statistics)
- Roman letters used to represent data about sample
- Sample mean: x̄
- Sample standard deviation: s
SYMBOLS
● X: usually indicates a value/observation
● N: usually indicates number of values/observations
● Σ: sum
● M: mean/average
● Xi: index; indicates which particular value is needed
RESEARCH CYCLE
1. Problem analysis (i.e. aim of the study)
2. Research design (how?)
3. Data collection
4. Data analysis
5. Reporting
VALIDITY AND RELIABILITY
Reliability
- degree to which multiple measurements come up with the same result (consistency)
eg - Test/retest reliability: repeating test
- Inter-rater reliability: comparing data from different participants
- Internal consistency: differently phrased questions assessing the same data
To increase reliability, increase sample size or decrease population standard deviation (changing
interest population)
Validity
— extent of measurement corresponding to what should be measured (accuracy)
, DISPLAYING DATA (non-exhaustive)
(1) Bar Graphs
Best used if
- not too many groups
- Groups all have sufficiently high frequencies
- Used for nominal or ordinal variables
Pros
- Immediately see groups with highest and lowest frequency
- Ratios can be observed easily
(2) Histogram
(3) Box Plot
- Interquartile Range (IQR)
- Range between Q1 to Q3 (middle 50%)
- Upper (Q3 +1.5 x IQR) and lower (Q1 - 1.5 x IQR) limits
- Whisker: last observation that would still meet the criteria (ie the most extreme value that still
sits within the value range)
- Q1, Q2 and Q3 values
— science of collecting, organizing, and interpreting numerical facts (i.e. data)
Statistics consists of a body of methods for obtaining and analyzing data, to:
1. Design (research studies)
2. Describe (the data)
3. Make inferences (based on these data)
1. Descriptive: summarises sample or population data with numbers, tables, and graphs
2. Inferential: generates predictions about population parameters, based on sample data
Statistical literacy
— ability to understand and critically evaluate statistical results that permeate our lives;
Coupled with ability to appreciate contributions that statistical thinking can make in
public and private, professional and personal decisions
Probability applies deduction; if we know the details of a certain population, how likely is a
certain outcome? (i.e. general → specific) → given model, predict data
Statistics apply induction; given a certain sample outcome, what can we say about the
population, and with what probability? (i.e specific → general) → given data, predict model
VARIABLES
– anything that is being measured, questioned, or kept a record of in research
Types of Variables
● Behavioral
● Stimulus
● Subject
● Physiological
Levels of measurement
categorical/
Qualitative
quantitative/
numerical
,Value Range
● Discrete: measure unit is indivisible (eg number of siblings)
● Continuous: unit is infinitely divisible (eg height)
POPULATION & SAMPLE
– population: entire interest group of individuals (parameter)
- Greek letters used to represent data about population
- Population mean: μ
- Population standard deviation: α
– sample: a subset of the population. Based on the sample, a claim is made about the population
(statistics)
- Roman letters used to represent data about sample
- Sample mean: x̄
- Sample standard deviation: s
SYMBOLS
● X: usually indicates a value/observation
● N: usually indicates number of values/observations
● Σ: sum
● M: mean/average
● Xi: index; indicates which particular value is needed
RESEARCH CYCLE
1. Problem analysis (i.e. aim of the study)
2. Research design (how?)
3. Data collection
4. Data analysis
5. Reporting
VALIDITY AND RELIABILITY
Reliability
- degree to which multiple measurements come up with the same result (consistency)
eg - Test/retest reliability: repeating test
- Inter-rater reliability: comparing data from different participants
- Internal consistency: differently phrased questions assessing the same data
To increase reliability, increase sample size or decrease population standard deviation (changing
interest population)
Validity
— extent of measurement corresponding to what should be measured (accuracy)
, DISPLAYING DATA (non-exhaustive)
(1) Bar Graphs
Best used if
- not too many groups
- Groups all have sufficiently high frequencies
- Used for nominal or ordinal variables
Pros
- Immediately see groups with highest and lowest frequency
- Ratios can be observed easily
(2) Histogram
(3) Box Plot
- Interquartile Range (IQR)
- Range between Q1 to Q3 (middle 50%)
- Upper (Q3 +1.5 x IQR) and lower (Q1 - 1.5 x IQR) limits
- Whisker: last observation that would still meet the criteria (ie the most extreme value that still
sits within the value range)
- Q1, Q2 and Q3 values

