

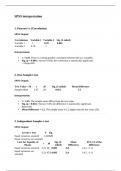
SPSS interpretation
1. Pearson’s r (Correlation)
SPSS Output:
Correlations Variable 1 Variable 2 Sig. (2-tailed)
Variable 1 1 0.78 0.001
Variable 2 0.78 1
Interpretation:
r = 0.78: There is a strong positive correlation between the two variables.
Sig. (p = 0.001): Since p<0.05p, the correlation is statistically significant.
-> Reject H0.
2. One-Sample t-test
SPSS Output:
Test Value = 50 t df Sig. (2-tailed) Mean Difference
Sample Mean 2.45 29 0.021 5.2
Interpretation:
t = 2.45: The sample mean differs from the test value.
Sig. (p = 0.021): Since p<0.05, the difference is statistically significant.
Reject H0.
Mean Difference = 5.2: The sample mean is 5.2 higher than the test value (50).
3. Independent Samples t-test
SPSS Output:
Levene's Test F Sig.
Equal variances assumed 1.34 0.25
Equal variances not assumed
t-test for Equality of Sig. (2- Mean 95% CI of the
t df
Means tailed) Difference Difference
Equal variances assumed -3.21 48 0.003 -2.8 [-4.5, -1.1]
Equal variances not
-3.21 45.6 0.003 -2.8 [-4.5, -1.1]
assumed
, Interpretation:
Levene’s test (p = 0.25): Since p≥0.05p, equal variances are assumed. Use the "Equal
variances assumed" row.
t = -3.21, p = 0.003: The group means are significantly different. Reject H0.
Mean Difference = -2.8: Group 1 has a mean 2.8 lower than Group 2.
4. ANOVA
SPSS Output:
ANOVA Sum of Squares df Mean Square F Sig.
Between Groups 45.2 2 22.6 5.78 0.004
Within Groups 156.8 57 2.75
Total 202.0 59
Interpretation:
F = 5.78, p = 0.004: Since p<0.05,at least one group mean significantly differs from
the others. Reject H0.
Post-hoc Tests (if provided): Examine pairwise comparisons to identify which
specific group means differ.
5. Chi-Square Test for Independence
SPSS Output:
Chi-Square Tests Value df Sig.
Pearson Chi-Square 12.5 2 0.002
Likelihood Ratio 13.2 2 0.001
Linear-by-Linear Assoc. 4.2 1 0.040
N of Valid Cases 200
Crosstabulation Table:
Group Category 1 Category 2 Category 3 Total
Variable A1 20 30 50 100
Variable A2 15 25 60 100
Interpretation:
Chi-Square (p = 0.002): Since p<0.05, the variables are significantly associated.
Reject H0
Crosstab Table: Compare observed and expected frequencies to interpret the nature
of the relationship.
1. Pearson’s r (Correlation)
SPSS Output:
Correlations Variable 1 Variable 2 Sig. (2-tailed)
Variable 1 1 0.78 0.001
Variable 2 0.78 1
Interpretation:
r = 0.78: There is a strong positive correlation between the two variables.
Sig. (p = 0.001): Since p<0.05p, the correlation is statistically significant.
-> Reject H0.
2. One-Sample t-test
SPSS Output:
Test Value = 50 t df Sig. (2-tailed) Mean Difference
Sample Mean 2.45 29 0.021 5.2
Interpretation:
t = 2.45: The sample mean differs from the test value.
Sig. (p = 0.021): Since p<0.05, the difference is statistically significant.
Reject H0.
Mean Difference = 5.2: The sample mean is 5.2 higher than the test value (50).
3. Independent Samples t-test
SPSS Output:
Levene's Test F Sig.
Equal variances assumed 1.34 0.25
Equal variances not assumed
t-test for Equality of Sig. (2- Mean 95% CI of the
t df
Means tailed) Difference Difference
Equal variances assumed -3.21 48 0.003 -2.8 [-4.5, -1.1]
Equal variances not
-3.21 45.6 0.003 -2.8 [-4.5, -1.1]
assumed
, Interpretation:
Levene’s test (p = 0.25): Since p≥0.05p, equal variances are assumed. Use the "Equal
variances assumed" row.
t = -3.21, p = 0.003: The group means are significantly different. Reject H0.
Mean Difference = -2.8: Group 1 has a mean 2.8 lower than Group 2.
4. ANOVA
SPSS Output:
ANOVA Sum of Squares df Mean Square F Sig.
Between Groups 45.2 2 22.6 5.78 0.004
Within Groups 156.8 57 2.75
Total 202.0 59
Interpretation:
F = 5.78, p = 0.004: Since p<0.05,at least one group mean significantly differs from
the others. Reject H0.
Post-hoc Tests (if provided): Examine pairwise comparisons to identify which
specific group means differ.
5. Chi-Square Test for Independence
SPSS Output:
Chi-Square Tests Value df Sig.
Pearson Chi-Square 12.5 2 0.002
Likelihood Ratio 13.2 2 0.001
Linear-by-Linear Assoc. 4.2 1 0.040
N of Valid Cases 200
Crosstabulation Table:
Group Category 1 Category 2 Category 3 Total
Variable A1 20 30 50 100
Variable A2 15 25 60 100
Interpretation:
Chi-Square (p = 0.002): Since p<0.05, the variables are significantly associated.
Reject H0
Crosstab Table: Compare observed and expected frequencies to interpret the nature
of the relationship.

