Leren Samenvatting 1
What is Machine Learning?
Tom Mitchell: “A computer program is said to learn from experience E with respect to some
class of tasks T and performance measure P, if its performance at tasks in T, as measured by
P, improves with experience E.”
Example: playing checkers
E = the experience of playing many games of checkers
T = tasks of playing checkers
P = the probability that the program will win the next game
Supervised Learning
In supervised learning, we are given a data set and already know what our correct output
should look like. Supervised learning problems are categorized into “regression” and
“classification” problems:
Regression problem: we are trying to predict results within a continuous output; we
are trying to map input variables into some continuous function.
o Example: Given a picture of Male/Female, predict his/her age on the basis of
the picture.
Classification problem: we are trying to predict results in a discrete output; we are
trying to map input variables into discrete categories.
o Example: Given a picture of Male/Female, predict whether he/she is of High
School, College, Graduate age.
Unsupervised Learning
Unsupervised learning allows us to approach problems with little or no idea what our results
should look like. We can derive structure from data by clustering the data based on
relationships among the variables in the data. Example:
Clustering: Take a collection of 1000 essays written on the US Economy, and find a
way to automatically group these essays into a small number that are somehow
similar or related by different variables, such as page count or word frequency.
Non-clustering: The “Cocktail Party Algorithm”, which can find structure in messy data
such as the identification of individual voices and music from a mesh of sounds at a
cocktail party.
Linear Regression with one variable (univariate linear regression)
Univariate linear regression is used when you want to predict a single output value y from a
single input value x.
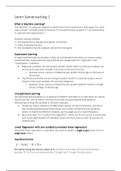
Hypothesis function
We will be trying out various values of θ0 and θ1 to find values which provide the best
possible “fit” or the most representative “straight line” through the data points.
What is Machine Learning?
Tom Mitchell: “A computer program is said to learn from experience E with respect to some
class of tasks T and performance measure P, if its performance at tasks in T, as measured by
P, improves with experience E.”
Example: playing checkers
E = the experience of playing many games of checkers
T = tasks of playing checkers
P = the probability that the program will win the next game
Supervised Learning
In supervised learning, we are given a data set and already know what our correct output
should look like. Supervised learning problems are categorized into “regression” and
“classification” problems:
Regression problem: we are trying to predict results within a continuous output; we
are trying to map input variables into some continuous function.
o Example: Given a picture of Male/Female, predict his/her age on the basis of
the picture.
Classification problem: we are trying to predict results in a discrete output; we are
trying to map input variables into discrete categories.
o Example: Given a picture of Male/Female, predict whether he/she is of High
School, College, Graduate age.
Unsupervised Learning
Unsupervised learning allows us to approach problems with little or no idea what our results
should look like. We can derive structure from data by clustering the data based on
relationships among the variables in the data. Example:
Clustering: Take a collection of 1000 essays written on the US Economy, and find a
way to automatically group these essays into a small number that are somehow
similar or related by different variables, such as page count or word frequency.
Non-clustering: The “Cocktail Party Algorithm”, which can find structure in messy data
such as the identification of individual voices and music from a mesh of sounds at a
cocktail party.
Linear Regression with one variable (univariate linear regression)
Univariate linear regression is used when you want to predict a single output value y from a
single input value x.
Hypothesis function
We will be trying out various values of θ0 and θ1 to find values which provide the best
possible “fit” or the most representative “straight line” through the data points.