

Tuesday, 10/29
➢ Statistic-descriptive measure of a sample
➢ Parameter-descriptive measure of a population
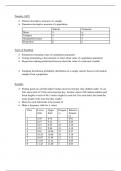
Statistic Parameter
Mean x̄ µ
Variance s2 δ2
Standard Deviation s δ
Proportion p̂ p
Types of Sampling
➢ Estimation-estimating value of a population parameter
➢ Testing-formulating a decision(true or false) about value of a population parameter
➢ Regression-making predictions/forecasts about the value of a statistical variable
➢ Sampling distribution-probability distribution of a sample statistic based on all random
samples from a population
Example
➢ Fishing pond says all fish under 6 inches must be returned, only children under 12 can
fish, and a limit of 5 fish can be kept per day. Jasmine selects 100 random children and
listed lengths of each of the 5 trouts caught by each fish. For each child, she found the
mean length of the trout that they caught.
➢ Mean for each child tends to be around 10
➢ Make a frequency table for x̄ values
Class Lower Upper Frequen Relative
limit limit cy frequen
cy
1 8.39 8.76 1 0.01
2 8.77 9.14 5 0.05
3 9.15 9.52 10 0.10
4 9.53 9.90 19 0.19
5 9.91 10.28 27 0.27
6 10.29 10.66 18 0.18
7 10.67 11.04 12 0.12
8 11.05 11.42 5 0.05
9 11.43 11.80 3 0.03
, Histogram for this data^
Guided Exercise
➢ What is a population parameter? Give an example.
→ Descriptive measure of a population(µ, δ)
➢ What is a sample statistic? Give an example.
→ Descriptive measure of a sample(x̄, s)
➢ What is a sampling distribution?
→ Probability distribution of a sampling statistic
➢ In Table 6-9, what makes up members of the sample? What sample statistic corresponds
to each sample? To which population parameter does this distribution correspond?
➢ Statistic-descriptive measure of a sample
➢ Parameter-descriptive measure of a population
Statistic Parameter
Mean x̄ µ
Variance s2 δ2
Standard Deviation s δ
Proportion p̂ p
Types of Sampling
➢ Estimation-estimating value of a population parameter
➢ Testing-formulating a decision(true or false) about value of a population parameter
➢ Regression-making predictions/forecasts about the value of a statistical variable
➢ Sampling distribution-probability distribution of a sample statistic based on all random
samples from a population
Example
➢ Fishing pond says all fish under 6 inches must be returned, only children under 12 can
fish, and a limit of 5 fish can be kept per day. Jasmine selects 100 random children and
listed lengths of each of the 5 trouts caught by each fish. For each child, she found the
mean length of the trout that they caught.
➢ Mean for each child tends to be around 10
➢ Make a frequency table for x̄ values
Class Lower Upper Frequen Relative
limit limit cy frequen
cy
1 8.39 8.76 1 0.01
2 8.77 9.14 5 0.05
3 9.15 9.52 10 0.10
4 9.53 9.90 19 0.19
5 9.91 10.28 27 0.27
6 10.29 10.66 18 0.18
7 10.67 11.04 12 0.12
8 11.05 11.42 5 0.05
9 11.43 11.80 3 0.03
, Histogram for this data^
Guided Exercise
➢ What is a population parameter? Give an example.
→ Descriptive measure of a population(µ, δ)
➢ What is a sample statistic? Give an example.
→ Descriptive measure of a sample(x̄, s)
➢ What is a sampling distribution?
→ Probability distribution of a sampling statistic
➢ In Table 6-9, what makes up members of the sample? What sample statistic corresponds
to each sample? To which population parameter does this distribution correspond?

