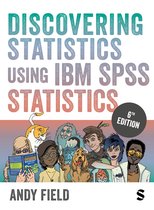
, 80 test questions and answers based on the book *Discovering Statistics
Using IBM SPSS Statistics* (6th edition) by Andy Field.
We’ve made these questions as a study group in preparation for the final
exams.
1. What is the primary goal of descriptive statistics?
- Answer: Descriptive statistics summarize and describe the features of
a dataset in a meaningful way, such as through measures of central
tendency, dispersion, and graphical representations.
2. What is a frequency distribution?
- Answer: A frequency distribution is a summary of how often each
different value occurs in a dataset.
3. What is the purpose of a histogram?
- Answer: A histogram is a graphical representation of the distribution of
a dataset. It shows the frequency of data points within certain ranges
(bins).
4. What does the term “central tendency” refer to?
- Answer: Central tendency refers to the central point or typical value in
a dataset, commonly measured using the mean, median, or mode.
5. What is the difference between the mean, median, and mode?
- Answer: The mean is the average of all data points, the median is the
middle value when data is ordered, and the mode is the value that occurs
most frequently.
6. How do you calculate the standard deviation?
- Answer: The standard deviation is calculated as the square root of the
variance, which measures the average squared deviation from the mean.
7. What is a z-score?
Using IBM SPSS Statistics* (6th edition) by Andy Field.
We’ve made these questions as a study group in preparation for the final
exams.
1. What is the primary goal of descriptive statistics?
- Answer: Descriptive statistics summarize and describe the features of
a dataset in a meaningful way, such as through measures of central
tendency, dispersion, and graphical representations.
2. What is a frequency distribution?
- Answer: A frequency distribution is a summary of how often each
different value occurs in a dataset.
3. What is the purpose of a histogram?
- Answer: A histogram is a graphical representation of the distribution of
a dataset. It shows the frequency of data points within certain ranges
(bins).
4. What does the term “central tendency” refer to?
- Answer: Central tendency refers to the central point or typical value in
a dataset, commonly measured using the mean, median, or mode.
5. What is the difference between the mean, median, and mode?
- Answer: The mean is the average of all data points, the median is the
middle value when data is ordered, and the mode is the value that occurs
most frequently.
6. How do you calculate the standard deviation?
- Answer: The standard deviation is calculated as the square root of the
variance, which measures the average squared deviation from the mean.
7. What is a z-score?