Introduction to R –
Probabilities and tables
Link to the data used is provided
,Let’s start at the beginning
• Open RStudio; create a new script
• Clear R’s memory
• Set your working directory to the same folder you used for the oth
sessions
,Let’s start at the beginning
• Open RStudio; create a new script
• Clear R’s memory
rm(list=ls())
• Set your working directory to the same folder you used for the oth
sessions
setwd(“C:/Users/dtros/Documents/Using R/Session 1”)
,
,Probability Distributions
R has functions for a variety of probability distributions
,Function rnorm()
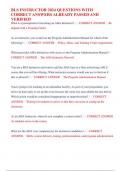
• To begin let’s find out what rnorm() is
• Bring up this functions help file
,
,Function rnorm()
• To begin let’s find out what rnorm() is
• Bring up this functions help file
• Were you able to do it? Remember that you can bring up a functio
help file using
?rnorm
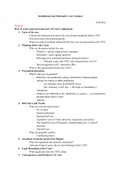
• This is the last function in the list for ‘Normal Distribution’
• The description of rnorm() is as follows – rnorm() generates
random numbers that are from a normal distribution
• Run the following
x <- rnorm(100000, mean = 0, sd = 1)
,
, Function rnorm()
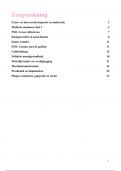
• Run the following
x <- rnorm(100000, mean = 0, sd = 1)
• As you can see, including spaces does not make a difference at this
point, as long as you have used the correct arguments and have
placed them in the correct order
• This line of code has produced 100 000 values from a standard
normal distribution; with a mean of 0 and a standard deviation of 1
Probabilities and tables
Link to the data used is provided
,Let’s start at the beginning
• Open RStudio; create a new script
• Clear R’s memory
• Set your working directory to the same folder you used for the oth
sessions
,Let’s start at the beginning
• Open RStudio; create a new script
• Clear R’s memory
rm(list=ls())
• Set your working directory to the same folder you used for the oth
sessions
setwd(“C:/Users/dtros/Documents/Using R/Session 1”)
,
,Probability Distributions
R has functions for a variety of probability distributions
,Function rnorm()
• To begin let’s find out what rnorm() is
• Bring up this functions help file
,
,Function rnorm()
• To begin let’s find out what rnorm() is
• Bring up this functions help file
• Were you able to do it? Remember that you can bring up a functio
help file using
?rnorm
• This is the last function in the list for ‘Normal Distribution’
• The description of rnorm() is as follows – rnorm() generates
random numbers that are from a normal distribution
• Run the following
x <- rnorm(100000, mean = 0, sd = 1)
,
, Function rnorm()
• Run the following
x <- rnorm(100000, mean = 0, sd = 1)
• As you can see, including spaces does not make a difference at this
point, as long as you have used the correct arguments and have
placed them in the correct order
• This line of code has produced 100 000 values from a standard
normal distribution; with a mean of 0 and a standard deviation of 1