
Vista previa 1 fuera de 2 páginas
Otro
MATH302 Week 2 Discussion; Frequency distributions and graphs; Data description
Vista previa 1 fuera de 2 páginas
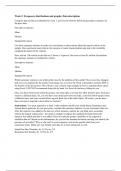
Week 2: Frequency distributions and graphs; Data description Using the data set that you identified in week 1, use Excel to find the following descriptive statistics for the price data. Descriptive statistics: Mean Median Standard Deviation Use these summary statistics to make two conclusions or observations about the typical vehicle in the sample. One conclusion must relate to the measure of center (mean/median) and one to the variability (standard deviation) of the vehicles. Next, add an 11th vehicle to the data set. Choose a "supercar" that costs at least $1 million. Recalculate the summary statistics to include this vehicle.
Información del documento
- Subido en
- 17 de diciembre de 2023
- Número de páginas
- 2
- Escrito en
- 2023/2024
- Tipo
- Otro
- Personaje
- Desconocido
$18.98
¿Documento equivocado? Cámbialo gratis
Dentro de los 14 días posteriores a la compra y antes de descargarlo, puedes elegir otro documento. Puedes gastar el importe de nuevo.
Escrito por estudiantes que aprobaron
Inmediatamente disponible después del pago
Leer en línea o como PDF

Los indicadores de reputación están sujetos a la cantidad de artículos vendidos por una tarifa y las reseñas que ha recibido por esos documentos. Hay tres niveles: Bronce, Plata y Oro. Cuanto mayor reputación, más podrás confiar en la calidad del trabajo del vendedor.
Disponible en paquete
Package deal
MATH302 All Discussions Week 1 - 8 (Package Deal)
