Vista previa 2 fuera de 12 páginas
Examen
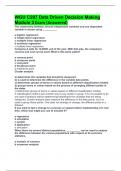
WGU C207 Data Driven Decision Making Module 3 Exam (Answered)
Vista previa 2 fuera de 12 páginas
The relationship between several independent variables and one dependent variable is shown using __________. a logistic regression b simple linear regression c multiple linear regression d nonlinear regression c multiple linear regression Company A sells its 12,000th unit of the year. With that sale, the company's revenue and cost curves meet. What is this point called? a revenue point b crossover point c cost point d breakeven point d breakeven point Cluster analysis
Información del documento
- Subido en
- 19 de octubre de 2023
- Número de páginas
- 12
- Escrito en
- 2023/2024
- Tipo
- Examen
- Contiene
- Preguntas y respuestas
$26.99
¿Documento equivocado? Cámbialo gratis
Dentro de los 14 días posteriores a la compra y antes de descargarlo, puedes elegir otro documento. Puedes gastar el importe de nuevo.
Escrito por estudiantes que aprobaron
Inmediatamente disponible después del pago
Leer en línea o como PDF