Examen
Information_Visualization_Week5_NEC_Solved
Puntuación
Vendido
-
Páginas
9
Grado
A+
Subido en
24-08-2023
Escrito en
2023/2024
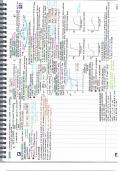
Experiment with the gapminder data to practice some of the new geoms we have learned. Try examining population or life expectancy over time using a series of boxplots. (Hint: you may need to use the group aesthetic in the aes() call.) Can you facet this boxplot by continent? Is anything different if you create a tibble from gapminder that explicitly groups the data by year and continent first, and then create your plots with that? Comment your code line by line. Explain what your charts are showing. Submit an R Markdown or submit screenshots with timestamps in a single Word file documenting your code and outcome .
Mostrar más
Leer menos
Institución
Information Visualization
Grado
Information Visualization
Ups! No podemos cargar tu documento ahora. Inténtalo de nuevo o contacta con soporte.
Libro relacionado
Data Visualization
- 2018
- 9780691181622
- Desconocido
Escuela, estudio y materia
- Institución
- Information Visualization
- Grado
- Information Visualization
Información del documento
- Subido en
- 24 de agosto de 2023
- Número de páginas
- 9
- Escrito en
- 2023/2024
- Tipo
- Examen
- Contiene
- Preguntas y respuestas
Temas
-
informationvisualizationweek5necsolved
$10.49
Accede al documento completo:
¿Documento equivocado? Cámbialo gratis
Dentro de los 14 días posteriores a la compra y antes de descargarlo, puedes elegir otro documento. Puedes gastar el importe de nuevo.
Escrito por estudiantes que aprobaron
Inmediatamente disponible después del pago
Leer en línea o como PDF
Documento también disponible en un lote
Package deal
Information_Visualization_NEC_All_7_Weeks_Solved
8
2023
$ 83.92
Más información