Activity
1. Using the map to help you,
oftropical rainforcst regions, describe the location
Cue, nane the
continents where they ate found and the latiude.
2, What does he name
his narural region? tropical ainforns ell you about
3. Look back at
paes 98 61.
a) Copy his table,
b) Give dhe average rainfalland
tropical rainforest regions. temperatures lor
Average raintall and temperatures tor
troplcal ralnforest regions
Termperatures in JanUary
Termperatures in July
|Annual average rainfall
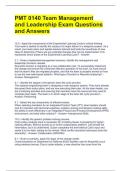
Temperature and rainfall graphs
Temperature and rainfall can change or vary
between months. You can show monthly rainfall and
temperature averages together on a graph. For example,
this graph shows the annual average temperature and
rainfall for Cape Town.
300 30
25
250
(°C)
temperature
20
rainfall
(mm)200
15
150
10
100
5
50
F M A M J AS O N D
Theline graph shows how the average temperature
changes. You'llsee thetemperature on the right side
1. Using the map to help you,
oftropical rainforcst regions, describe the location
Cue, nane the
continents where they ate found and the latiude.
2, What does he name
his narural region? tropical ainforns ell you about
3. Look back at
paes 98 61.
a) Copy his table,
b) Give dhe average rainfalland
tropical rainforest regions. temperatures lor
Average raintall and temperatures tor
troplcal ralnforest regions
Termperatures in JanUary
Termperatures in July
|Annual average rainfall
Temperature and rainfall graphs
Temperature and rainfall can change or vary
between months. You can show monthly rainfall and
temperature averages together on a graph. For example,
this graph shows the annual average temperature and
rainfall for Cape Town.
300 30
25
250
(°C)
temperature
20
rainfall
(mm)200
15
150
10
100
5
50
F M A M J AS O N D
Theline graph shows how the average temperature
changes. You'llsee thetemperature on the right side