02 – variables and data
Measurement levels: variables can be categorical and continuous
Categorical > nominal & ordinal
Continuous > interval & ratio
Starting point for statistical analysis is data matrix
Four basic questions to choose the adequate analysis technique:
- Is the research question…: descriptive, explanatory, static, dynamic?
- Are the variables…: nominal, ordinal, interval or ratio?
- Is the relationship between variables…: univariate, correlation or causal?
- Are there any criteria for analysis technique like…: measurement level of
variables/shape of distribution etc.?
This is an iterative process
03 – describing data, central tendency
Describing data, three characteristics:
Central tendency: where is the midpoint of the variable, center
Dispersion: how are the scores spread around the midpoint, widely or close to midpoint
Shape: what does the distribution of scores look like, symmetric or not
The applicability depends on the measurement level of the variables
1. Frequencies
Most basic way of describing data is using frequency data: can be used for all
measurement levels. Not always very useful or informative, for variables measured in
a lot of categories. Frequencies is about how many times a certain score appears in
your data.
2. Central tendency
Measures of central tendency are a way to summarize a range of scores in terms of a
midpoint or center. Data from frequency table are displayed in histogram.
Three measures of central tendency
1. Mode: score that occurs most frequently, easily found
2. Median: middle score of the variables when all data are ordered from low to high.
(n (number of respondents) + ) > less affected by extreme scores
3. Mean: the average score > much affected by extreme scores
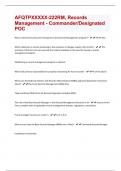
Nominal Ordinal Interval Ratio
CAN be used Mode Mode Mode Mode
Median Median Median
Mean Mean
MOST Mode Median Symmetrical variable: Symmetrical variable:
adequate to use Mean Mean
Skewed variable: Skewed variable:
Median Median
, 04 – describing data, dispersion
Dispersion: how are the scores spread around the midpoint, widely or close to midpoint
>Only useful when the scores range from low to high: only useful for ordinal, interval or ratio
Three measures of dispersion
1. Range: the highest score minus the lowest
2. Inter quartile range: the range in which the middle 50% of the scores lies: distance
between the upper quartile (Qu) and the lower quartile (Ql): Qu – Ql.
3. Standard deviation: the average distance between the scores and the mean. The
higher your standard deviation, the more widely the observations are spread.
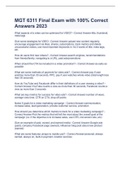
Nominal Ordinal Interval Ratio
CAN be used None Range Range Range
IQR IQR IQR
Standard deviation Standard deviation
MOST None IQR Symmetrical variable: Symmetrical variable:
adequate to use Standard deviation Standard deviation
Skewed variable: Skewed variable:
IQR IQR
05 – dispersion interpretation
Range: the higher the range, the more widely the scores are spread. Gives the least useful
information.
IQR: the higher the IQR, the more widely the scores are spread around the median.
Standard deviation: tells you how close ore widely the observations are spread around the
mean.
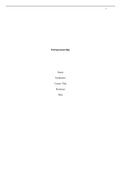
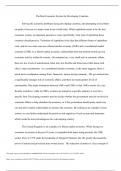
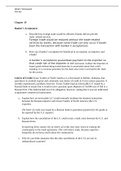
> Balanced distribution
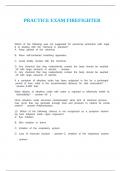
> Unbalanced distribution
Measurement levels: variables can be categorical and continuous
Categorical > nominal & ordinal
Continuous > interval & ratio
Starting point for statistical analysis is data matrix
Four basic questions to choose the adequate analysis technique:
- Is the research question…: descriptive, explanatory, static, dynamic?
- Are the variables…: nominal, ordinal, interval or ratio?
- Is the relationship between variables…: univariate, correlation or causal?
- Are there any criteria for analysis technique like…: measurement level of
variables/shape of distribution etc.?
This is an iterative process
03 – describing data, central tendency
Describing data, three characteristics:
Central tendency: where is the midpoint of the variable, center
Dispersion: how are the scores spread around the midpoint, widely or close to midpoint
Shape: what does the distribution of scores look like, symmetric or not
The applicability depends on the measurement level of the variables
1. Frequencies
Most basic way of describing data is using frequency data: can be used for all
measurement levels. Not always very useful or informative, for variables measured in
a lot of categories. Frequencies is about how many times a certain score appears in
your data.
2. Central tendency
Measures of central tendency are a way to summarize a range of scores in terms of a
midpoint or center. Data from frequency table are displayed in histogram.
Three measures of central tendency
1. Mode: score that occurs most frequently, easily found
2. Median: middle score of the variables when all data are ordered from low to high.
(n (number of respondents) + ) > less affected by extreme scores
3. Mean: the average score > much affected by extreme scores
Nominal Ordinal Interval Ratio
CAN be used Mode Mode Mode Mode
Median Median Median
Mean Mean
MOST Mode Median Symmetrical variable: Symmetrical variable:
adequate to use Mean Mean
Skewed variable: Skewed variable:
Median Median
, 04 – describing data, dispersion
Dispersion: how are the scores spread around the midpoint, widely or close to midpoint
>Only useful when the scores range from low to high: only useful for ordinal, interval or ratio
Three measures of dispersion
1. Range: the highest score minus the lowest
2. Inter quartile range: the range in which the middle 50% of the scores lies: distance
between the upper quartile (Qu) and the lower quartile (Ql): Qu – Ql.
3. Standard deviation: the average distance between the scores and the mean. The
higher your standard deviation, the more widely the observations are spread.
Nominal Ordinal Interval Ratio
CAN be used None Range Range Range
IQR IQR IQR
Standard deviation Standard deviation
MOST None IQR Symmetrical variable: Symmetrical variable:
adequate to use Standard deviation Standard deviation
Skewed variable: Skewed variable:
IQR IQR
05 – dispersion interpretation
Range: the higher the range, the more widely the scores are spread. Gives the least useful
information.
IQR: the higher the IQR, the more widely the scores are spread around the median.
Standard deviation: tells you how close ore widely the observations are spread around the
mean.
> Balanced distribution
> Unbalanced distribution