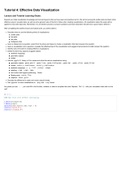
Tutorial 4: Effective Data Visualization
Lecture and Tutorial Learning Goals:
Expand your data visualization knowledge and tool set beyond what we have seen and practiced so far. We will move beyond scatter plots and learn other
effective ways to visualize data, as well as some general rules of thumb to follow when creating visualizations. All visualization tasks this week will be
applied to real world data sets. Remember, it is an iterative process to answer questions and each step taken should have a good reason behind it.
After completing this week's lecture and tutorial work, you will be able to:
Describe when to use the following kinds of visualizations:
scatter plots
line plots
bar plots
histogram plots
Given a dataset and a question, select from the above plot types to create a visualization that best answers the question
Given a visualization and a question, evaluate the effectiveness of the visualization and suggest improvements to better answer the question
Identify rules of thumb for creating effective visualizations
Define the three key aspects of ggplot objects:
aesthetic mappings
geometric objects
scales
Use the ggplot2 library in R to create and refine the above visualizations using:
geometric objects: geom_point , geom_line , geom_histogram , geom_bar , geom_vline , geom_hline
scales: scale_x_continuous , scale_y_continuous
aesthetic mappings: x , y , fill , colour , shape
labelling: xlab , ylab , labs
font control and legend positioning: theme
flipping axes: coord_flip
subplots: facet_grid
Describe the difference in raster and vector output formats
Use ggsave to save visualizations in .png and .svg format
Any place you see ... , you must fill in the function, variable, or data to complete the code. Replace fail() with your completed code and run the
cell!
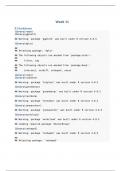
In [ ]:
### Run this cell before continuing.
library(tidyverse)
library(repr)
options(repr.matrix.max.rows = 6)
source("tests.R")
source("cleanup.R")
, Question 0.1
{points: 1}
Match the following definitions with the corresponding aesthetic mapping or function used in R:
Definitions
A. Prevents a chart from being stacked. It preserves the vertical position of a plot while adjusting the horizontal position.
B. In bar charts, this aesthetic fills in the bars by a specific colour or separates the counts by a variable different from the x-axis.
C. In bar charts, it outlines the bars but in scatterplots, it fills in the points (colouring them based on a particular variable aside from the x/y-axis).
D. This makes the height of each bar equal to the number of cases in each group, and it is incompatible with mapping values to the y aesthetic. This stat
basically allows the y-axis to represent particular values from the data instead of just counts.
E. This aesthetic allows further visualization of data by varying data points by shape (modifying their shape based on a particular variable aside from the
x/y-axis).
F. Labels the y-axis.
Aesthetics and Functions
1. colour
2. dodge
3. fill
4. identity
5. ylab
6. shape
For every description, create an object using the letter associated with the definition and assign it to the corresponding number from the list above. For
example: B <- 1
In [ ]:
# Replace the fail() with your answer.
### BEGIN SOLUTION
C <- 1
A <- 2
B <- 3
D <- 4
F <- 5
E <- 6
### END SOLUTION
In [ ]:
test_0.1()
Question 0.2 True or False:
{points: 1}
We should save a plot as an .svg file if we want to be able to rescale it without losing quality.
Assign your answer to an object called answer0.2 . Make sure your answer is in lowercase letters and is surrounded by quotation marks (e.g. "true"
or "false" ).
In [ ]:
# Replace the fail() with your answer.
### BEGIN SOLUTION
answer0.2 <- "true"
### END SOLUTION
In [ ]:
test_0.2()
Lecture and Tutorial Learning Goals:
Expand your data visualization knowledge and tool set beyond what we have seen and practiced so far. We will move beyond scatter plots and learn other
effective ways to visualize data, as well as some general rules of thumb to follow when creating visualizations. All visualization tasks this week will be
applied to real world data sets. Remember, it is an iterative process to answer questions and each step taken should have a good reason behind it.
After completing this week's lecture and tutorial work, you will be able to:
Describe when to use the following kinds of visualizations:
scatter plots
line plots
bar plots
histogram plots
Given a dataset and a question, select from the above plot types to create a visualization that best answers the question
Given a visualization and a question, evaluate the effectiveness of the visualization and suggest improvements to better answer the question
Identify rules of thumb for creating effective visualizations
Define the three key aspects of ggplot objects:
aesthetic mappings
geometric objects
scales
Use the ggplot2 library in R to create and refine the above visualizations using:
geometric objects: geom_point , geom_line , geom_histogram , geom_bar , geom_vline , geom_hline
scales: scale_x_continuous , scale_y_continuous
aesthetic mappings: x , y , fill , colour , shape
labelling: xlab , ylab , labs
font control and legend positioning: theme
flipping axes: coord_flip
subplots: facet_grid
Describe the difference in raster and vector output formats
Use ggsave to save visualizations in .png and .svg format
Any place you see ... , you must fill in the function, variable, or data to complete the code. Replace fail() with your completed code and run the
cell!
In [ ]:
### Run this cell before continuing.
library(tidyverse)
library(repr)
options(repr.matrix.max.rows = 6)
source("tests.R")
source("cleanup.R")
, Question 0.1
{points: 1}
Match the following definitions with the corresponding aesthetic mapping or function used in R:
Definitions
A. Prevents a chart from being stacked. It preserves the vertical position of a plot while adjusting the horizontal position.
B. In bar charts, this aesthetic fills in the bars by a specific colour or separates the counts by a variable different from the x-axis.
C. In bar charts, it outlines the bars but in scatterplots, it fills in the points (colouring them based on a particular variable aside from the x/y-axis).
D. This makes the height of each bar equal to the number of cases in each group, and it is incompatible with mapping values to the y aesthetic. This stat
basically allows the y-axis to represent particular values from the data instead of just counts.
E. This aesthetic allows further visualization of data by varying data points by shape (modifying their shape based on a particular variable aside from the
x/y-axis).
F. Labels the y-axis.
Aesthetics and Functions
1. colour
2. dodge
3. fill
4. identity
5. ylab
6. shape
For every description, create an object using the letter associated with the definition and assign it to the corresponding number from the list above. For
example: B <- 1
In [ ]:
# Replace the fail() with your answer.
### BEGIN SOLUTION
C <- 1
A <- 2
B <- 3
D <- 4
F <- 5
E <- 6
### END SOLUTION
In [ ]:
test_0.1()
Question 0.2 True or False:
{points: 1}
We should save a plot as an .svg file if we want to be able to rescale it without losing quality.
Assign your answer to an object called answer0.2 . Make sure your answer is in lowercase letters and is surrounded by quotation marks (e.g. "true"
or "false" ).
In [ ]:
# Replace the fail() with your answer.
### BEGIN SOLUTION
answer0.2 <- "true"
### END SOLUTION
In [ ]:
test_0.2()