
Vista previa 2 fuera de 8 páginas
Examen
STAT 200 Week 7 Homework Problems
Vista previa 2 fuera de 8 páginas
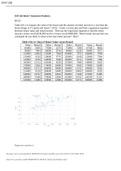
STAT 200 Week 7 Homework Problems 10.1.2 Table #10.1.6 contains the value of the house and the amount of rental income in a year that the house brings in ("Capital and rental," 2013). Create a scatter plot and find a regression equation between house value and rental income. Then use the regression equation to find the rental income a house worth $230,000 and for a house worth $400,000. Which rental income that you calculated do you think is closer to the true rental income? Why? Table #10.1.6: Data of House Value versus Rental Value Rental Value Rental Value Rental Value Rental Regression equation is This study source was downloaded by from CourseHERO
Información del documento
- Subido en
- 25 de febrero de 2022
- Número de páginas
- 8
- Escrito en
- 2021/2022
- Tipo
- Examen
- Contiene
- Preguntas y respuestas
$14.48
¿Documento equivocado? Cámbialo gratis
Dentro de los 14 días posteriores a la compra y antes de descargarlo, puedes elegir otro documento. Puedes gastar el importe de nuevo.
Escrito por estudiantes que aprobaron
Inmediatamente disponible después del pago
Leer en línea o como PDF

Los indicadores de reputación están sujetos a la cantidad de artículos vendidos por una tarifa y las reseñas que ha recibido por esos documentos. Hay tres niveles: Bronce, Plata y Oro. Cuanto mayor reputación, más podrás confiar en la calidad del trabajo del vendedor.
