DNA Structure Questions (20 marks)
Q1. DNA is composed of four different DNA nucleotides.
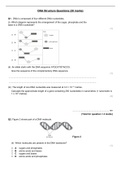
(i) Which diagram represents the arrangement of the sugar, phosphate and the
base in a DNA nucleotide?
(1)
(ii) An allele starts with the DNA sequence ATGCATGTACCG.
Give the sequence of the complementary DNA sequence.
(1)
.............................................................................................................................................
.............................................................................................................................................
(iii) The length of one DNA nucleotide was measured at 3.3 × 10⁻¹⁰ metres.
Calculate the approximate length of a gene containing 250 nucleotides in nanometres (1 nanometre is
1 x 10⁻⁹ metres).
(2)
........................................................... nm
(Total for question = 4 marks)
Q2. Figure 2 shows part of a DNA molecule.
Figure 2
(ii) Which molecules are present in the DNA backbone?
(1)
A sugars and phosphates
B amino acids and bases
C sugars and bases
D amino acids and phosphates
, Q3. Figure 6 shows the percentage of each base in human DNA.
Describe how this data provides evidence for base pairing in DNA.
(2)
.............................................................................................................................................
.............................................................................................................................................
.............................................................................................................................................
.............................................................................................................................................
.............................................................................................................................................
Q4. The bar chart shows the percentage of guanine and thymine in a sample of DNA.
Complete the bar chart to show the percentage of adenine and cytosine in the sample.
(2)
Q1. DNA is composed of four different DNA nucleotides.
(i) Which diagram represents the arrangement of the sugar, phosphate and the
base in a DNA nucleotide?
(1)
(ii) An allele starts with the DNA sequence ATGCATGTACCG.
Give the sequence of the complementary DNA sequence.
(1)
.............................................................................................................................................
.............................................................................................................................................
(iii) The length of one DNA nucleotide was measured at 3.3 × 10⁻¹⁰ metres.
Calculate the approximate length of a gene containing 250 nucleotides in nanometres (1 nanometre is
1 x 10⁻⁹ metres).
(2)
........................................................... nm
(Total for question = 4 marks)
Q2. Figure 2 shows part of a DNA molecule.
Figure 2
(ii) Which molecules are present in the DNA backbone?
(1)
A sugars and phosphates
B amino acids and bases
C sugars and bases
D amino acids and phosphates
, Q3. Figure 6 shows the percentage of each base in human DNA.
Describe how this data provides evidence for base pairing in DNA.
(2)
.............................................................................................................................................
.............................................................................................................................................
.............................................................................................................................................
.............................................................................................................................................
.............................................................................................................................................
Q4. The bar chart shows the percentage of guanine and thymine in a sample of DNA.
Complete the bar chart to show the percentage of adenine and cytosine in the sample.
(2)