Chapter 1.8 (pp. 22-39)
When the data are quantitative this involves both looking at your data graphically to see what
the general trends in the data are, and also fitting statistical models to the data.
1.8.1 Frequency distributions
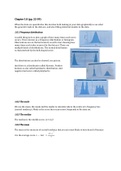
A useful thing to do is plot a graph of how many times each score
occurs. This is known as a frequency distribution or histogram.
Observations are on the horizontal x-as with a bar showing how
many times each value occurred in the data set. There are
multiple kinds of distributions. The normal distribution
is characterized by the bell-shaped curve.
The distribution can also be skewed: see picture.
And there is a distribution called Kurtosis. Positive
kurtosis is also called leptokurtic distribution. And
negative kurtosis is called platykurtic.
1.8.2 The mode
We use the mean, the mode and the media to calculate where the centre of a frequency lies
(central tendency). Mode is the score that occurs most frequently in the data set.
1.8.3 The median
The median is the middle score. (n+1)/2
1.8.4 The mean
The mean is the measure of central tendency that you are most likely to have heard of because
𝑥𝑖
𝑛
Σ𝑖 =1
it is the average score. 𝑥 − 𝑏𝑎𝑟 = 𝑛
,Cramming Sam’s Tips: Central tendency
- The mean is the sum of all scores divided by the number of scores. The value of the
mean can be influenced quite heavily by extreme scores
- The median is the middle score when the scores are placed in ascending order. It is not
as influenced by extreme scores as the mean
- The mode is the score that occurs most frequently.
,Lecture 1 (6-9) introductie
Content this week:
- exploratory research - causal models with confounding variables
- correlation
- partial correlation
Explanatory research
- this course is primarily concerned with explanatory research: the why or causes of
social phenomena
- cause and effect relationships or causal relations, are often represented in a causal
model
- in this course we examine the relationships in a causal model in a deductive manner:
- by having derived hypotheses from the theory
- by statistically testing these on real live data
Example: Reading behavior among young adults
- Reading books is not popular among young people
and the question is what can be done about it? Does
it matter if young people had to read a lot of books in
school? does that encourage reading behavior>
Hypothesis; the more books young people had to read for
school, the more books they read later.
Research design
How to test the hypothesis
- to design a study in such a way that the
hypotheses are tested in a critical way
- by formulating the hypothesis in such a
way that they are refutable
- by taking measures that allow you to
conclude with more certainty that a
relationship is truly causal
- by taking into account possible
underlying variables or alternative
explanations
- Because ultimately we want to check the extent to which the causal relationships
assumed by the ……………
How to interpret this correlation?
- Het is positief (weak), dus als je op de leeslijst hoger scoort, scoor je hoger op het lezen.
Dus er lijkt een relatie te zijn tussen de leeslijst en lezen. Maar is dit causaal? Dat kun je
niet zeggen. We moeten een variabele zoeken die causaal is. Dit moet the cause zijn van
beide variabele. Dit is de confounding variable (deze veroorzaakt beide variabele). Kan
, zijn het niveau van scholing. Op hogere scholen lees je meer boeken dan op lagere
scholingen. En daarom lees je waarschijnlijk meer dan de lager opgeleide mensen.
………
weak correlation .10 medium strong .30 strong correlation .50
Controlling for a confounding variable.
daarbij filter je seduc secondary
education level uit. Dan zie je dat het
veranderd. De relatie wordt negatief en
minder sterk.
Correlation and causation
- correlation is not the same as causation
- Correltion: changes in one variable correlate with changes in another
- Causation: changes in one variable cause changes in the other
- With causation, you make very strong claims, so you have to be able to justify that well
- you do that by excluding confounding variables.
- In Spss, you can calculate a correlation, but spss tells you nothing about to what extent
that indicates a causal relationship
- you have to infer causality, from the extent to which confounding variables …..
Example question
A researcher finds a positive correlation of .121 between the number of books on the reading
list in secondary school and the amount of reading later in life. Can she conclude that the size of
the reading list in school causes the subsequent amount of reading?
No, there needs to be controlled for confounding variables, which precede both the reading list
at school and subsequent reading frequency
When the data are quantitative this involves both looking at your data graphically to see what
the general trends in the data are, and also fitting statistical models to the data.
1.8.1 Frequency distributions
A useful thing to do is plot a graph of how many times each score
occurs. This is known as a frequency distribution or histogram.
Observations are on the horizontal x-as with a bar showing how
many times each value occurred in the data set. There are
multiple kinds of distributions. The normal distribution
is characterized by the bell-shaped curve.
The distribution can also be skewed: see picture.
And there is a distribution called Kurtosis. Positive
kurtosis is also called leptokurtic distribution. And
negative kurtosis is called platykurtic.
1.8.2 The mode
We use the mean, the mode and the media to calculate where the centre of a frequency lies
(central tendency). Mode is the score that occurs most frequently in the data set.
1.8.3 The median
The median is the middle score. (n+1)/2
1.8.4 The mean
The mean is the measure of central tendency that you are most likely to have heard of because
𝑥𝑖
𝑛
Σ𝑖 =1
it is the average score. 𝑥 − 𝑏𝑎𝑟 = 𝑛
,Cramming Sam’s Tips: Central tendency
- The mean is the sum of all scores divided by the number of scores. The value of the
mean can be influenced quite heavily by extreme scores
- The median is the middle score when the scores are placed in ascending order. It is not
as influenced by extreme scores as the mean
- The mode is the score that occurs most frequently.
,Lecture 1 (6-9) introductie
Content this week:
- exploratory research - causal models with confounding variables
- correlation
- partial correlation
Explanatory research
- this course is primarily concerned with explanatory research: the why or causes of
social phenomena
- cause and effect relationships or causal relations, are often represented in a causal
model
- in this course we examine the relationships in a causal model in a deductive manner:
- by having derived hypotheses from the theory
- by statistically testing these on real live data
Example: Reading behavior among young adults
- Reading books is not popular among young people
and the question is what can be done about it? Does
it matter if young people had to read a lot of books in
school? does that encourage reading behavior>
Hypothesis; the more books young people had to read for
school, the more books they read later.
Research design
How to test the hypothesis
- to design a study in such a way that the
hypotheses are tested in a critical way
- by formulating the hypothesis in such a
way that they are refutable
- by taking measures that allow you to
conclude with more certainty that a
relationship is truly causal
- by taking into account possible
underlying variables or alternative
explanations
- Because ultimately we want to check the extent to which the causal relationships
assumed by the ……………
How to interpret this correlation?
- Het is positief (weak), dus als je op de leeslijst hoger scoort, scoor je hoger op het lezen.
Dus er lijkt een relatie te zijn tussen de leeslijst en lezen. Maar is dit causaal? Dat kun je
niet zeggen. We moeten een variabele zoeken die causaal is. Dit moet the cause zijn van
beide variabele. Dit is de confounding variable (deze veroorzaakt beide variabele). Kan
, zijn het niveau van scholing. Op hogere scholen lees je meer boeken dan op lagere
scholingen. En daarom lees je waarschijnlijk meer dan de lager opgeleide mensen.
………
weak correlation .10 medium strong .30 strong correlation .50
Controlling for a confounding variable.
daarbij filter je seduc secondary
education level uit. Dan zie je dat het
veranderd. De relatie wordt negatief en
minder sterk.
Correlation and causation
- correlation is not the same as causation
- Correltion: changes in one variable correlate with changes in another
- Causation: changes in one variable cause changes in the other
- With causation, you make very strong claims, so you have to be able to justify that well
- you do that by excluding confounding variables.
- In Spss, you can calculate a correlation, but spss tells you nothing about to what extent
that indicates a causal relationship
- you have to infer causality, from the extent to which confounding variables …..
Example question
A researcher finds a positive correlation of .121 between the number of books on the reading
list in secondary school and the amount of reading later in life. Can she conclude that the size of
the reading list in school causes the subsequent amount of reading?
No, there needs to be controlled for confounding variables, which precede both the reading list
at school and subsequent reading frequency