6,
@#&&*#&()&(*&)*$*)($*)*@($*(*@)$(*@$(&(*$$(&*$($2ZOIZHxh-2Page
3:41:2010/27/2026,
AM~~~~~~())))))))))))))(@)(*@U*(8_
4:25:30 AM8_ Nonlinear Regression
Nonlinear Regression
Functions test
Functions
1complete
of 98_
test
Nonlinear
solution10/27/2026,
completeRegression
solution@#&&*#&()&(*&)*$*)($*)*@($*(*@)$(*@$(&(*$$(&*$($2ZOIZHxh-2Page
3:41:20
Functions
AM~~~~~~())))))))))))))(@)(*@U*(8_
test complete solution.pdf10/27/2026,
Nonlinear
3:41:39
Regression
AM Fu
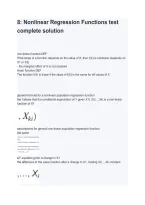
8: Nonlinear Regression Functions test
complete solution
non-linear function DEF
If the slope of a function depends on the value of X, then f(X) is nonlinear (depends on
X1 or X2)
- the marginal effect of X is not constant
linear function DEF
The function f(X) is linear if the slope of f(X) is the same for all values of X
Brainpower
Read More
0:04
/
0:15
general formula for a nonlinear population regression function
the f allows that the conditional expectation of Y given X1i, X2i,...,Xki is a non-linear
function of X1
assumptions for general non-linear population regression function
the same
ΔY equation given a change in X1
the difference in the value function after a change in X1, holding X2,...,Xk constant
6,
@#&&*#&()&(*&)*$*)($*)*@($*(*@)$(*@$(&(*$$(&*$($2ZOIZHxh-2Page
3:41:2010/27/2026,
AM~~~~~~())))))))))))))(@)(*@U*(8_
4:25:30 AM8_ Nonlinear Regression
Nonlinear Regression
Functions test
Functions
1complete
of 98_
test
Nonlinear
solution10/27/2026,
completeRegression
solution@#&&*#&()&(*&)*$*)($*)*@($*(*@)$(*@$(&(*$$(&*$($2ZOIZHxh-2Page
3:41:20
Functions
AM~~~~~~())))))))))))))(@)(*@U*(8_
test complete solution.pdf10/27/2026,
Nonlinear
3:41:39
Regression
AM Fu
,6,
@#&&*#&()&(*&)*$*)($*)*@($*(*@)$(*@$(&(*$$(&*$($2ZOIZHxh-2Page
3:41:2010/27/2026,
AM~~~~~~())))))))))))))(@)(*@U*(8_
4:25:30 AM8_ Nonlinear Regression
Nonlinear Regression
Functions test
Functions
2complete
of 98_
test
Nonlinear
solution10/27/2026,
completeRegression
solution@#&&*#&()&(*&)*$*)($*)*@($*(*@)$(*@$(&(*$$(&*$($2ZOIZHxh-2Page
3:41:20
Functions
AM~~~~~~())))))))))))))(@)(*@U*(8_
test complete solution.pdf10/27/2026,
Nonlinear
3:41:39
Regression
AM Fu
given the regression function f is unknown, the population causal effect is unknown.
what do we do?
we estimate the effect and the function f^
the difference between the predicted values for the two cases, thus the predicted
change in Y based on estimator f^ is
two approaches to modelling nonlinear functions
(1) polynomials in X; the population regression function is approximated by a quadratic,
cubic or higher-degree polynomial
(2) logarithmic transformations; Y and/or X is transformed by taking its logarithm, which
provides a percentages interpretation of the coefficients
polynomial approach
polynomial approach
use same OLS procedure
how do we interpret the coefficient of the polynomial equation?
it is difficult to interpret these coefficients (not the same as OLS), but the regression
itself is interpretable
commands on STATA to generate a quadratic term
STATA output with quadratic term
- both linear and quadratic term as significant
6,
@#&&*#&()&(*&)*$*)($*)*@($*(*@)$(*@$(&(*$$(&*$($2ZOIZHxh-2Page
3:41:2010/27/2026,
AM~~~~~~())))))))))))))(@)(*@U*(8_
4:25:30 AM8_ Nonlinear Regression
Nonlinear Regression
Functions test
Functions
2complete
of 98_
test
Nonlinear
solution10/27/2026,
completeRegression
solution@#&&*#&()&(*&)*$*)($*)*@($*(*@)$(*@$(&(*$$(&*$($2ZOIZHxh-2Page
3:41:20
Functions
AM~~~~~~())))))))))))))(@)(*@U*(8_
test complete solution.pdf10/27/2026,
Nonlinear
3:41:39
Regression
AM Fu
@#&&*#&()&(*&)*$*)($*)*@($*(*@)$(*@$(&(*$$(&*$($2ZOIZHxh-2Page
3:41:2010/27/2026,
AM~~~~~~())))))))))))))(@)(*@U*(8_
4:25:30 AM8_ Nonlinear Regression
Nonlinear Regression
Functions test
Functions
1complete
of 98_
test
Nonlinear
solution10/27/2026,
completeRegression
solution@#&&*#&()&(*&)*$*)($*)*@($*(*@)$(*@$(&(*$$(&*$($2ZOIZHxh-2Page
3:41:20
Functions
AM~~~~~~())))))))))))))(@)(*@U*(8_
test complete solution.pdf10/27/2026,
Nonlinear
3:41:39
Regression
AM Fu
8: Nonlinear Regression Functions test
complete solution
non-linear function DEF
If the slope of a function depends on the value of X, then f(X) is nonlinear (depends on
X1 or X2)
- the marginal effect of X is not constant
linear function DEF
The function f(X) is linear if the slope of f(X) is the same for all values of X
Brainpower
Read More
0:04
/
0:15
general formula for a nonlinear population regression function
the f allows that the conditional expectation of Y given X1i, X2i,...,Xki is a non-linear
function of X1
assumptions for general non-linear population regression function
the same
ΔY equation given a change in X1
the difference in the value function after a change in X1, holding X2,...,Xk constant
6,
@#&&*#&()&(*&)*$*)($*)*@($*(*@)$(*@$(&(*$$(&*$($2ZOIZHxh-2Page
3:41:2010/27/2026,
AM~~~~~~())))))))))))))(@)(*@U*(8_
4:25:30 AM8_ Nonlinear Regression
Nonlinear Regression
Functions test
Functions
1complete
of 98_
test
Nonlinear
solution10/27/2026,
completeRegression
solution@#&&*#&()&(*&)*$*)($*)*@($*(*@)$(*@$(&(*$$(&*$($2ZOIZHxh-2Page
3:41:20
Functions
AM~~~~~~())))))))))))))(@)(*@U*(8_
test complete solution.pdf10/27/2026,
Nonlinear
3:41:39
Regression
AM Fu
,6,
@#&&*#&()&(*&)*$*)($*)*@($*(*@)$(*@$(&(*$$(&*$($2ZOIZHxh-2Page
3:41:2010/27/2026,
AM~~~~~~())))))))))))))(@)(*@U*(8_
4:25:30 AM8_ Nonlinear Regression
Nonlinear Regression
Functions test
Functions
2complete
of 98_
test
Nonlinear
solution10/27/2026,
completeRegression
solution@#&&*#&()&(*&)*$*)($*)*@($*(*@)$(*@$(&(*$$(&*$($2ZOIZHxh-2Page
3:41:20
Functions
AM~~~~~~())))))))))))))(@)(*@U*(8_
test complete solution.pdf10/27/2026,
Nonlinear
3:41:39
Regression
AM Fu
given the regression function f is unknown, the population causal effect is unknown.
what do we do?
we estimate the effect and the function f^
the difference between the predicted values for the two cases, thus the predicted
change in Y based on estimator f^ is
two approaches to modelling nonlinear functions
(1) polynomials in X; the population regression function is approximated by a quadratic,
cubic or higher-degree polynomial
(2) logarithmic transformations; Y and/or X is transformed by taking its logarithm, which
provides a percentages interpretation of the coefficients
polynomial approach
polynomial approach
use same OLS procedure
how do we interpret the coefficient of the polynomial equation?
it is difficult to interpret these coefficients (not the same as OLS), but the regression
itself is interpretable
commands on STATA to generate a quadratic term
STATA output with quadratic term
- both linear and quadratic term as significant
6,
@#&&*#&()&(*&)*$*)($*)*@($*(*@)$(*@$(&(*$$(&*$($2ZOIZHxh-2Page
3:41:2010/27/2026,
AM~~~~~~())))))))))))))(@)(*@U*(8_
4:25:30 AM8_ Nonlinear Regression
Nonlinear Regression
Functions test
Functions
2complete
of 98_
test
Nonlinear
solution10/27/2026,
completeRegression
solution@#&&*#&()&(*&)*$*)($*)*@($*(*@)$(*@$(&(*$$(&*$($2ZOIZHxh-2Page
3:41:20
Functions
AM~~~~~~())))))))))))))(@)(*@U*(8_
test complete solution.pdf10/27/2026,
Nonlinear
3:41:39
Regression
AM Fu