OPM Supplement B
Waiting Line = one or more “customers” waiting for service
- Waiting lines form due to a temporary imbalance between the demand for
service and the capacity of the system
Structure of waiting line problems:
1. An input, or customers population, that generates potential customers
2. A waiting line of customers
3. The service facility, consisting of a person (or crew), a machine (or group
machines), or both necessary to perform the service for the customer
4. A priority rule, which selects the next customer to be served by the service
facility
Numer of lines:
- Single (1 kassa, 1 rij)
- Multiple (meerdere kassa’s, meerdere
rijen)
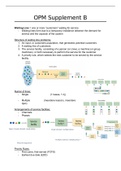
Arrangements of service facilties:
- Channels
- Phases
Figuur 1single channel, single phase Single channel, multiple phase Multiple channel, single phase
Multiple channel, multiple phase ->
Mixed Arrangement
Priority Rules:
- First come, first-served (FCFS)
- Earliest due date (EDD)
, - Shortest processing time (SPT)
- Preemptive discipline = a rule that allows a customer of higher priority to
interrupt the service of another customer
Probability Distributions:
- Arrival distribution
Pn = Probability of n arrivals in T time periods
λ = Average numbers of customer arrivals per period
e = 2.7183
- Remark: e = Euler’s number, a mathematical constant that is the base of the
natural logarithm. It is approximately equal to 2.71828 and is the limit of (1 +
1/n)n as n approaches infinity. It can also be calculated as the sum of the
infinite series
- Service time distribution
μ = average number of customers completing service per period
t = service time of the customer
T = target service time
Using waiting line models to analyze operations:
- Balance gains that might be made by increasing the efficiency of the service
systems against the costs of doing so
- Operating charactistics
o Line length
o Number of customers in system
o Waiting time in line
o Total time in system
o Service facility utilization
Single server model: