D603 | MACHINE LEARNING | TASK 3
WESTERN GOVERNORS UNIVERSITY
DATA SCIENCE • MACHINE LEARNING
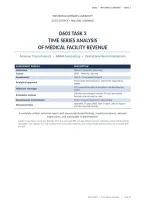
D603 TASK 3
TIME SERIES ANALYSIS
OF MEDICAL FACILITY REVENUE
Revenue Trend Analysis • ARIMA Forecasting • Operational Recommendations
ASSESSMENT PROFILE DESCRIPTION
Institution Western Governors University
Course D603 – Machine Learning
Assessment Task 3 – Time Series Analysis
Time-series decomposition, stationarity diagnostics,
Analytical approach
ARIMA
731 consecutive daily observations, as described by
Historical coverage
source
146-day chronological holdout; 91-day operational
Evaluation horizon
forecast also included in code
Development environment Python / Jupyter Notebook / statsmodels
Uploaded 17-page D603 Task 3 report, with its figures
Document basis
and documented findings
A complete written technical report with source-attributed findings, model procedures, decision
implications, and executable implementation.
Evidence standard: numerical findings from the provided PDF are described as source-reported unless independently
calculable. The original 731-row revenue CSV, executed notebook, and actual GitLab address were not included with
the PDF.
WGU D603 • Time Series Analysis | Page 1
, D603 | MACHINE LEARNING | TASK 3
CONTENTS
Executive Summary
A. GitLab Repository and Version Control
B1. Research Question
B2. Analysis Objectives and Goals
C. Time Series Assumptions
D1. Time Series Line Graph
D2. Time-Step Formatting
D3. Stationarity Evaluation
D4. Data Preparation
D5. Cleaned Dataset
E1. Annotated Exploration: Trend, ACF/PACF, Spectrum, Decomposition and Residuals
E2. ARIMA Model Identification
E3. Forecasting and Prediction Intervals
E4. Output and Calculations
F1. Model Results and Interpretation
F2. Forecast Visualization and Decision Reading
F3. Course of Action
G. Industry-Relevant IDE Report
H. Web Sources
I. References
J. Professional Communication
Appendix A. Executable Python Analysis
Appendix B. Deliverables and Reproducibility
Appendix C. Source Data and Evidence Reconciliation
WGU D603 • Time Series Analysis | Page 2
, D603 | MACHINE LEARNING | TASK 3
EXECUTIVE SUMMARY
Healthcare administrators must anticipate changes in operating revenue to plan staffing, maintain
appropriate liquidity, prioritize investments, and respond to unexpected demand. This project applies
univariate time-series methods to a record of 731 daily medical-facility revenue observations. Its goal
is to examine temporal patterns, assess stationarity, select a defensible ARIMA model, evaluate
forecast errors, and translate prediction uncertainty into planning actions.
The uploaded report describes time-series line plots, moving averages, autocorrelation and partial
autocorrelation diagnostics, a power spectrum, decomposition, stationarity tests, and ARIMA
forecasting. It reports first differencing as necessary, a final candidate ARIMA(1,1,0), a 146-day
forecast, and 95% prediction intervals. These statements guide the presentation and the
accompanying reproducible Python workflow.
The source attributes an MAE of 2.84 million revenue units, RMSE of 3.67 million, MAPE of 5.8%, and
Ljung–Box residual test p-value of 0.156 to its model. Because the original dataset, model object, and
forecast output are absent, those statistics cannot be independently certified here. Moreover, some
source figures use inconsistent revenue scales, and another section identifies ARIMA(2,1,2). These
discrepancies are documented in Appendix C rather than concealed.
A chronological 585-observation development sample and 146-observation holdout sample provide a
defensible evaluation design for the full 731-observation series. The implementation separately
produces a 91-day future forecast for an approximate calendar quarter and a 146-day extension to
preserve the source study horizon. The code fits candidate ARIMA(p,1,q) specifications, reports AIC
and BIC, tests residual autocorrelation, measures out-of-sample error, and exports dated-by-day
forecast tables and figures.
The principal operational recommendation is to use revenue forecasts as a regularly updated planning
input, not as guaranteed receipts. Leadership should review forecast errors, monitor downside
prediction limits, investigate persistent revenue shifts, and avoid fixed spending decisions based
solely on a single point estimate.
A. GITLAB REPOSITORY AND VERSION CONTROL
GitLab supports traceability from the revenue data through preparation, diagnostic tests, model
selection, forecasting, and final communication. The supplied report contains a screenshot of a D603
repository, but no accessible GitLab URL is included in the text. The project narrative therefore
describes the required project contents and version-control controls without asserting independent
repository access.
The repository should retain the source dataset only where its use is authorized, the complete
executable notebook or script, a requirements file, cleaned data, exported model-comparison table,
forecast results, visualization outputs, and a README that specifies the run sequence. Source data
and generated outputs should be separated to avoid confusing original observations with computed
artifacts.
REPOSITORY AREA CONTENTS AND PURPOSE
Study question, variables, execution instructions, project
README.md
structure, interpretation
Version-controlled preprocessing, diagnostics, ARIMA
analysis.py / D603_Task3_Analysis.ipynb
fitting and forecasting
input/ Original authorized 731-day revenue series
Cleaned CSV, stationarity tests, AIC grid, forecasts, charts
D603_Task3_Output/
and model summary
requirements.txt Environment packages and versions captured at
WGU D603 • Time Series Analysis | Page 3