
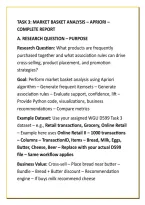
TASK 3: MARKET BASKET ANALYSIS – APRIORI –
COMPLETE REPORT
A. RESEARCH QUESTION – PURPOSE
Research Question: What products are frequently
purchased together and what association rules can drive
cross-selling, product placement, and promotion
strategies?
Goal: Perform market basket analysis using Apriori
algorithm – Generate frequent itemsets – Generate
association rules – Evaluate support, confidence, lift –
Provide Python code, visualizations, business
recommendations – Compare metrics
Example Dataset: Use your assigned WGU D599 Task 3
dataset – e.g., Retail transactions, Grocery, Online Retail
– Example here uses Online Retail II – 1000 transactions
– Columns – TransactionID, Items – Bread, Milk, Eggs,
Butter, Cheese, Beer – Replace with your actual D599
file – Same workflow applies
Business Value: Cross-sell – Place bread near butter –
Bundle – Bread + Butter discount – Recommendation
engine – If buys milk recommend cheese
,B. CONCEPTS – SUPPORT, CONFIDENCE, LIFT
Definitions – High-Yield for D599:
• Support: Frequency itemset appears – Support{A} =
Transactions containing A / Total transactions – e.g.,
Bread appears in 400/1000 = 0.4 – Frequent if
support >= min_support – Filters rare items
• Confidence: Conditional probability – Confidence{A-
>B} = Support{A,B} / Support{A} – e.g., 300
transactions have bread+butter, 400 have bread –
Confidence Bread->Butter = 300/400=0.75 – 75%
who buy bread buy butter – Measures reliability
• Lift: How much more likely B given A vs random –
Lift{A->B} = Confidence{A->B} / Support{B} =
Support{A,B} / (Support{A}*Support{B}) – Lift=1
independent, >1 positive association, <1 negative –
Most important – e.g., Support Bread 0.4 Butter 0.3
Both 0.3 – Confidence 0.75 – Support Butter 0.3 –
Lift 0.75/0.3=2.5 – 2.5x more likely to buy butter if
buy bread than random
, • Conviction: Direction – Conviction{A->B} = (1-
Support{B})/(1-Confidence{A->B}) – Higher means
stronger
• Leverage: Difference – Leverage = Support{A,B} -
Support{A}*Support{B} – 0 independent
Thresholds – Typical:
• min_support 0.01-0.05 – 1-5% – Too high misses rare
but profitable – Too low too many rules – Depends
dataset size
• min_confidence 0.3-0.6 – 30-60%
• min_lift >1.0 – Usually >1.2 for actionable – Filter lift
>1 for positive
• For D599 – Use min_support 0.02, min_confidence
0.5, min_lift 1.2 – Document justification
C. DATA PREPARATION – PYTHON – FULL CODE
Step 1: Import Libraries
Python
import pandas as pdimport numpy as npimport
matplotlib.pyplot as pltimport seaborn as snsfrom

