
s://www.stuvia.com/user/allatopnotchPage
0223081422stat_200__week_6__solutions_.docxPage
https://www.stuvia.com/user/allatopnotchPage
1 of 13https://www.stuvia.com/user/allatopnotchhttps://www.stuvia.com/user/allatopnotch
11ofof13https://www.stuvia.com/user/allatopnotchhttps://www.stuvia.com/user/allatopn
13https://www.stuvia.com/user/allatopnotchhttps://www.stuvia.com/user/allatopn
STAT 200 Week 6 Homework Problems
9.1.2
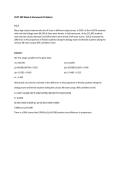
Many high school students take the AP tests in different subject areas. In 2007, of the 144,796 students
who took the biology exam 84,199 of them were female. In that same year, of the 211,693 students
who took the calculus AB exam 102,598 of them were female ("AP exam scores," 2013). Estimate the
difference in the proportion of female students taking the biology exam and female students taking the
calculus AB exam using a 90% confidence level.
Solution:
We first assign variables to the given data:
n1=144,796 n2=211,693
p1=84199/144796 = 0.582 p2=102598/211693 = 0.485
q1=1-0.582 = 0.418 q1=1-0.485 = 0.515
zc = 1.645
Afterwards, we solve for estimate of the difference in the proportion of female students taking the
biology exam and female students taking the calculus AB exam using a 90% confidence level.
E=1.645*sqrt[{(0.582*0.418)/144796}+{90.485*0.515)/211693}]
E= 0.0028
(0.582-0.485)-0.0028<p1-p2<(0.582-0.485)+0.0028
0.0942<p1-p2<0.998
There is a 90% chance that 0.0942<p1-p2<0.998 contains true difference in proportions.
s://www.stuvia.com/user/allatopnotchPage
https://www.stuvia.com/user/allatopnotchPage
1 of 13https://www.stuvia.com/user/allatopnotchhttps://www.stuvia.com/user/allatopnotch
1 of 13https://www.stuvia.com/user/allatopnotchhttps://www.stuvia.com/user/allatopn
,s://www.stuvia.com/user/allatopnotchPage
0223081422stat_200__week_6__solutions_.docxPage
https://www.stuvia.com/user/allatopnotchPage
2 of 13https://www.stuvia.com/user/allatopnotchhttps://www.stuvia.com/user/allatopnotch
22ofof13https://www.stuvia.com/user/allatopnotchhttps://www.stuvia.com/user/allatopn
13https://www.stuvia.com/user/allatopnotchhttps://www.stuvia.com/user/allatopn
9.1.5
Are there more children diagnosed with Autism Spectrum Disorder (ASD) in states that have larger
urban areas over states that are mostly rural? In the state of Pennsylvania, a fairly urban state, there
are 245 eight year olds diagnosed with ASD out of 18,440 eight year olds evaluated. In the state of Utah,
a fairly rural state, there are 45 eight year olds diagnosed with ASD out of 2,123 eight year olds
evaluated ("Autism and developmental," 2008). Is there enough evidence to show that the proportion
of children diagnosed with ASD in Pennsylvania is more than the proportion in Utah? Test at the 1%
level.
Solution:
We first assign variables to the given data:
n1=18,440 n2=2,123
x1=245 x2=45
p1=245/18440 = 0.013 p2=45/2123 = 0.021
q1=1-0.013 = 0.987 q1=1-0.021 = 0.979
Substitution:
p-= (245+45)/(18440+2123) = 0.014
q-=1-0.014 = 0.986
z={(0.013+0.021)-0}/sqrt[{(0.014*0.986)/18440}+{(0.014*0.986)/2123}]
z=12.760
Hence, there is enough evidence that the proportion of children diagnosed with ASD in
Pennsylvania is more than the proportion in Utah.
s://www.stuvia.com/user/allatopnotchPage
https://www.stuvia.com/user/allatopnotchPage
2 of 13https://www.stuvia.com/user/allatopnotchhttps://www.stuvia.com/user/allatopnotch
2 of 13https://www.stuvia.com/user/allatopnotchhttps://www.stuvia.com/user/allatopn
0223081422stat_200__week_6__solutions_.docxPage
https://www.stuvia.com/user/allatopnotchPage
1 of 13https://www.stuvia.com/user/allatopnotchhttps://www.stuvia.com/user/allatopnotch
11ofof13https://www.stuvia.com/user/allatopnotchhttps://www.stuvia.com/user/allatopn
13https://www.stuvia.com/user/allatopnotchhttps://www.stuvia.com/user/allatopn
STAT 200 Week 6 Homework Problems
9.1.2
Many high school students take the AP tests in different subject areas. In 2007, of the 144,796 students
who took the biology exam 84,199 of them were female. In that same year, of the 211,693 students
who took the calculus AB exam 102,598 of them were female ("AP exam scores," 2013). Estimate the
difference in the proportion of female students taking the biology exam and female students taking the
calculus AB exam using a 90% confidence level.
Solution:
We first assign variables to the given data:
n1=144,796 n2=211,693
p1=84199/144796 = 0.582 p2=102598/211693 = 0.485
q1=1-0.582 = 0.418 q1=1-0.485 = 0.515
zc = 1.645
Afterwards, we solve for estimate of the difference in the proportion of female students taking the
biology exam and female students taking the calculus AB exam using a 90% confidence level.
E=1.645*sqrt[{(0.582*0.418)/144796}+{90.485*0.515)/211693}]
E= 0.0028
(0.582-0.485)-0.0028<p1-p2<(0.582-0.485)+0.0028
0.0942<p1-p2<0.998
There is a 90% chance that 0.0942<p1-p2<0.998 contains true difference in proportions.
s://www.stuvia.com/user/allatopnotchPage
https://www.stuvia.com/user/allatopnotchPage
1 of 13https://www.stuvia.com/user/allatopnotchhttps://www.stuvia.com/user/allatopnotch
1 of 13https://www.stuvia.com/user/allatopnotchhttps://www.stuvia.com/user/allatopn
,s://www.stuvia.com/user/allatopnotchPage
0223081422stat_200__week_6__solutions_.docxPage
https://www.stuvia.com/user/allatopnotchPage
2 of 13https://www.stuvia.com/user/allatopnotchhttps://www.stuvia.com/user/allatopnotch
22ofof13https://www.stuvia.com/user/allatopnotchhttps://www.stuvia.com/user/allatopn
13https://www.stuvia.com/user/allatopnotchhttps://www.stuvia.com/user/allatopn
9.1.5
Are there more children diagnosed with Autism Spectrum Disorder (ASD) in states that have larger
urban areas over states that are mostly rural? In the state of Pennsylvania, a fairly urban state, there
are 245 eight year olds diagnosed with ASD out of 18,440 eight year olds evaluated. In the state of Utah,
a fairly rural state, there are 45 eight year olds diagnosed with ASD out of 2,123 eight year olds
evaluated ("Autism and developmental," 2008). Is there enough evidence to show that the proportion
of children diagnosed with ASD in Pennsylvania is more than the proportion in Utah? Test at the 1%
level.
Solution:
We first assign variables to the given data:
n1=18,440 n2=2,123
x1=245 x2=45
p1=245/18440 = 0.013 p2=45/2123 = 0.021
q1=1-0.013 = 0.987 q1=1-0.021 = 0.979
Substitution:
p-= (245+45)/(18440+2123) = 0.014
q-=1-0.014 = 0.986
z={(0.013+0.021)-0}/sqrt[{(0.014*0.986)/18440}+{(0.014*0.986)/2123}]
z=12.760
Hence, there is enough evidence that the proportion of children diagnosed with ASD in
Pennsylvania is more than the proportion in Utah.
s://www.stuvia.com/user/allatopnotchPage
https://www.stuvia.com/user/allatopnotchPage
2 of 13https://www.stuvia.com/user/allatopnotchhttps://www.stuvia.com/user/allatopnotch
2 of 13https://www.stuvia.com/user/allatopnotchhttps://www.stuvia.com/user/allatopn

