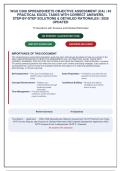
WGU C268 SPREADSHEETS OBJECTIVE ASSESSMENT (OA) | 45
PRACTICAL EXCEL TASKS WITH CORRECT ANSWERS,
STEP-BY-STEP SOLUTIONS & DETAILED RATIONALES | 2026
UPDATED
70 Questions with Answers and Detailed Rationales
100 PERCENT GUARANTEED PASS
INSTANT DOWNLOAD ANSWERS INCLUDED
IMPORTANCE OF THIS DOCUMENT
This comprehensive examination preparation guide has been meticulously developed to help you succeed in the
WGU C268 SPREADSHEETS OBJECTIVE ASSESSMENT (OA) | 45 PRACTICAL EXCEL TASKS WITH
CORRECT ANSWERS, STEP-BY-STEP SOLUTIONS & DETAILED RATIONALES | 2026 UPDATED. It contains
70 carefully selected questions that reflect the most current exam content and testing strategies. Each question is
accompanied by a correct answer and a detailed rationale that explains the underlying pathophysiology,
pharmacology, or clinical reasoning.
Self-Assessment – Test your knowledge and Exam Preparation – Familiarize yourself with the
identify areas requiring further question format and content
study areas
Concept Reinforcement – Deepen your Confidence Building – Develop test-taking
understanding through strategies and reduce
evidence-based exam anxiety
rationales
Time Management – Practice answering
questions under simulated
exam conditions
Review Summary 70 Questions
Foundations - Application - WGU C268 Spreadsheets Objective Assessment OA 45 Practical Excel Tasks
WITH Correct Step-by-step Solutions & Detailed Rationales 2026 Updated Spreadsheet Applications AND
DATA Analysis Excel Undergraduate YEAR 3 / Graduate
All answers with rationales
,Table of Contents
Content Area Questions Key Topics
Spreadsheet Fundamentals 1-12 Correctly, Column, YOU NEED, Formula, Excel
AND Interface Navigation
Formulas AND Functions 13-24 Column, Correctly, Formula, Value, Table
Mathematical Statistical
Logical
DATA Visualization Charts 25-36 Formula, Correctly, Column, Number, Table
AND Graphs
DATA Management Sorting 37-48 Formula, Correctly, YOU NEED, Excel, Create
Filtering Tables
Conditional Formatting AND 49-60 Formula, Column, Correctly, Values, Sales
DATA Validation
What-if Analysis Scenario 61-70 YOU NEED, Formula, Sales, Column, Create
Manager GOAL SEEK DATA
Tables
TOTAL 70 All questions include answers and detailed rationales
,Section A - Spreadsheet Fundamentals AND Interface
Navigation
Q1.
In a financial model, you need to return the future value of a series of uneven cash flows
at a variable discount rate stored in separate cells. Which Excel function combination
correctly accounts for non-periodic cash flows and a variable rate?
A. =XNPV(rate, values, dates) B. =NPV(rate, values) + initial investment
C. =XIRR(values, dates, guess) D. =FV(rate, nper, pmt, [pv], [type])
Correct: A - =XNPV(rate, values, dates)
Rationale:XNPV calculates net present value for cash flows occurring at irregular intervals,
exactly matching the scenario of uneven cash flows with a variable discount rate. NPV
assumes periodic, equally spaced cash flows. XIRR returns a rate, not future value. FV
assumes constant periodic payments.
Why the other answers are wrong:
B. NPV assumes equal time periods between cash flows, which is invalid for uneven timing.
C. XIRR calculates an internal rate of return, not a future value.
D. FV is designed for regular, constant cash flows, not uneven or irregular ones.
Reference: WGU C268, Module on Financial Functions (XNPV, XIRR)
Q2.
A dataset contains sales records with duplicate entries. You need to remove duplicates
based on all columns except the 'Order ID' column, and also count the number of unique
remaining records. Which approach correctly accomplishes this without using Power
Query?
A. Use 'Remove Duplicates' on all columns, B. Use 'Remove Duplicates' on all columns
then use =COUNTA(range) to count. except 'Order ID', then use
=SUBTOTAL(103, range) to count.
C. Use 'Advanced Filter' with unique records D. Use conditional formatting to highlight
only, then use =SUM to count. duplicates, then manually delete and count.
Correct: B - Use 'Remove Duplicates' on all columns except 'Order ID', then use
=SUBTOTAL(103, range) to count.
Page 3
, Section A - Spreadsheet Fundamentals AND Interface Navigation
Rationale: Remove Duplicates allows selecting specific columns to define duplicates; ignoring
'Order ID' will remove rows that are identical in all other fields. SUBTOTAL(103, range) counts
visible cells after filtering (or after removal), giving the number of unique records. COUNTA
would count all non-empty cells, not unique. Advanced Filter can extract unique but doesn't
remove. Manual deletion is error-prone.
Why the other answers are wrong:
A. Removing duplicates on all columns will not remove rows that differ only in Order ID, and
COUNTA counts all entries.
C. Advanced Filter extracts unique records but does not remove duplicates from the original
dataset.
D. Manual deletion is not a systematic approach and SUBTOTAL is not used.
Reference: WGU C268, Data Cleaning and Subtotals
Q3.
You are building a dynamic chart that should automatically exclude rows where the
corresponding cell in column A is blank. Which combination of Excel features ensures the
chart updates correctly when new data is added or removed?
A. Use a static range and manually adjust B. Define a named range using =OFFSET(S
the chart data source each time. heet1!$A$1,0,0,COUNTA(Sheet1!$A:$A),1)
and use it in the chart series.
C. Apply a filter to hide blank rows and D. Use a PivotChart with the data in a table
create a chart from the filtered data. format.
Correct: B - Define a named range using
=OFFSET(Sheet1!$A$1,0,0,COUNTA(Sheet1!$A:$A),1) and use it in the chart series.
Rationale:A dynamic named range using OFFSET and COUNTA automatically adjusts the
chart's data range as entries are added or removed, ensuring blanks are excluded. Static
ranges require manual updates. Filtering hides blanks but chart may still include hidden data
unless set to ignore. PivotCharts require refresh but can include blanks unless filtered.
Why the other answers are wrong:
A. Static ranges do not automatically update and may include blank rows.
C. Filtering does not automatically exclude blanks from a chart unless specific settings are
used, and it is not dynamic for new rows.
D. PivotCharts typically include blank cells unless filtered, and they require manual refresh.
Reference: WGU C268, Dynamic Ranges and Charting
Q4.
In a complex What-If analysis, you need to determine the optimal product mix that
maximizes profit subject to constraints on labor hours and raw materials. Which Excel
tool should you use, and what is the correct way to set up the objective cell?
Page 4
PRACTICAL EXCEL TASKS WITH CORRECT ANSWERS,
STEP-BY-STEP SOLUTIONS & DETAILED RATIONALES | 2026
UPDATED
70 Questions with Answers and Detailed Rationales
100 PERCENT GUARANTEED PASS
INSTANT DOWNLOAD ANSWERS INCLUDED
IMPORTANCE OF THIS DOCUMENT
This comprehensive examination preparation guide has been meticulously developed to help you succeed in the
WGU C268 SPREADSHEETS OBJECTIVE ASSESSMENT (OA) | 45 PRACTICAL EXCEL TASKS WITH
CORRECT ANSWERS, STEP-BY-STEP SOLUTIONS & DETAILED RATIONALES | 2026 UPDATED. It contains
70 carefully selected questions that reflect the most current exam content and testing strategies. Each question is
accompanied by a correct answer and a detailed rationale that explains the underlying pathophysiology,
pharmacology, or clinical reasoning.
Self-Assessment – Test your knowledge and Exam Preparation – Familiarize yourself with the
identify areas requiring further question format and content
study areas
Concept Reinforcement – Deepen your Confidence Building – Develop test-taking
understanding through strategies and reduce
evidence-based exam anxiety
rationales
Time Management – Practice answering
questions under simulated
exam conditions
Review Summary 70 Questions
Foundations - Application - WGU C268 Spreadsheets Objective Assessment OA 45 Practical Excel Tasks
WITH Correct Step-by-step Solutions & Detailed Rationales 2026 Updated Spreadsheet Applications AND
DATA Analysis Excel Undergraduate YEAR 3 / Graduate
All answers with rationales
,Table of Contents
Content Area Questions Key Topics
Spreadsheet Fundamentals 1-12 Correctly, Column, YOU NEED, Formula, Excel
AND Interface Navigation
Formulas AND Functions 13-24 Column, Correctly, Formula, Value, Table
Mathematical Statistical
Logical
DATA Visualization Charts 25-36 Formula, Correctly, Column, Number, Table
AND Graphs
DATA Management Sorting 37-48 Formula, Correctly, YOU NEED, Excel, Create
Filtering Tables
Conditional Formatting AND 49-60 Formula, Column, Correctly, Values, Sales
DATA Validation
What-if Analysis Scenario 61-70 YOU NEED, Formula, Sales, Column, Create
Manager GOAL SEEK DATA
Tables
TOTAL 70 All questions include answers and detailed rationales
,Section A - Spreadsheet Fundamentals AND Interface
Navigation
Q1.
In a financial model, you need to return the future value of a series of uneven cash flows
at a variable discount rate stored in separate cells. Which Excel function combination
correctly accounts for non-periodic cash flows and a variable rate?
A. =XNPV(rate, values, dates) B. =NPV(rate, values) + initial investment
C. =XIRR(values, dates, guess) D. =FV(rate, nper, pmt, [pv], [type])
Correct: A - =XNPV(rate, values, dates)
Rationale:XNPV calculates net present value for cash flows occurring at irregular intervals,
exactly matching the scenario of uneven cash flows with a variable discount rate. NPV
assumes periodic, equally spaced cash flows. XIRR returns a rate, not future value. FV
assumes constant periodic payments.
Why the other answers are wrong:
B. NPV assumes equal time periods between cash flows, which is invalid for uneven timing.
C. XIRR calculates an internal rate of return, not a future value.
D. FV is designed for regular, constant cash flows, not uneven or irregular ones.
Reference: WGU C268, Module on Financial Functions (XNPV, XIRR)
Q2.
A dataset contains sales records with duplicate entries. You need to remove duplicates
based on all columns except the 'Order ID' column, and also count the number of unique
remaining records. Which approach correctly accomplishes this without using Power
Query?
A. Use 'Remove Duplicates' on all columns, B. Use 'Remove Duplicates' on all columns
then use =COUNTA(range) to count. except 'Order ID', then use
=SUBTOTAL(103, range) to count.
C. Use 'Advanced Filter' with unique records D. Use conditional formatting to highlight
only, then use =SUM to count. duplicates, then manually delete and count.
Correct: B - Use 'Remove Duplicates' on all columns except 'Order ID', then use
=SUBTOTAL(103, range) to count.
Page 3
, Section A - Spreadsheet Fundamentals AND Interface Navigation
Rationale: Remove Duplicates allows selecting specific columns to define duplicates; ignoring
'Order ID' will remove rows that are identical in all other fields. SUBTOTAL(103, range) counts
visible cells after filtering (or after removal), giving the number of unique records. COUNTA
would count all non-empty cells, not unique. Advanced Filter can extract unique but doesn't
remove. Manual deletion is error-prone.
Why the other answers are wrong:
A. Removing duplicates on all columns will not remove rows that differ only in Order ID, and
COUNTA counts all entries.
C. Advanced Filter extracts unique records but does not remove duplicates from the original
dataset.
D. Manual deletion is not a systematic approach and SUBTOTAL is not used.
Reference: WGU C268, Data Cleaning and Subtotals
Q3.
You are building a dynamic chart that should automatically exclude rows where the
corresponding cell in column A is blank. Which combination of Excel features ensures the
chart updates correctly when new data is added or removed?
A. Use a static range and manually adjust B. Define a named range using =OFFSET(S
the chart data source each time. heet1!$A$1,0,0,COUNTA(Sheet1!$A:$A),1)
and use it in the chart series.
C. Apply a filter to hide blank rows and D. Use a PivotChart with the data in a table
create a chart from the filtered data. format.
Correct: B - Define a named range using
=OFFSET(Sheet1!$A$1,0,0,COUNTA(Sheet1!$A:$A),1) and use it in the chart series.
Rationale:A dynamic named range using OFFSET and COUNTA automatically adjusts the
chart's data range as entries are added or removed, ensuring blanks are excluded. Static
ranges require manual updates. Filtering hides blanks but chart may still include hidden data
unless set to ignore. PivotCharts require refresh but can include blanks unless filtered.
Why the other answers are wrong:
A. Static ranges do not automatically update and may include blank rows.
C. Filtering does not automatically exclude blanks from a chart unless specific settings are
used, and it is not dynamic for new rows.
D. PivotCharts typically include blank cells unless filtered, and they require manual refresh.
Reference: WGU C268, Dynamic Ranges and Charting
Q4.
In a complex What-If analysis, you need to determine the optimal product mix that
maximizes profit subject to constraints on labor hours and raw materials. Which Excel
tool should you use, and what is the correct way to set up the objective cell?
Page 4