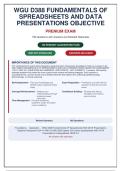
WGU D388 FUNDAMENTALS OF
SPREADSHEETS AND DATA
PRESENTATIONS OBJECTIVE
PRENIUM EXAM
190 Questions with Answers and Detailed Rationales
100 PERCENT GUARANTEED PASS
INSTANT DOWNLOAD ANSWERS INCLUDED
IMPORTANCE OF THIS DOCUMENT
This comprehensive examination preparation guide has been meticulously developed to help you succeed in the
WGU D388 FUNDAMENTALS OF SPREADSHEETS AND DATA PRESENTATIONS OBJECTIVE ASSESSMENT
| OA V1 AND V2 | QUESTIONS AND ANSWERS | 2026 UPDATE | 100% CORRECT.. It contains 190 carefully
selected questions that reflect the most current exam content and testing strategies. Each question is
accompanied by a correct answer and a detailed rationale that explains the underlying pathophysiology,
pharmacology, or clinical reasoning.
Self-Assessment – Test your knowledge and Exam Preparation – Familiarize yourself with the
identify areas requiring further question format and content
study areas
Concept Reinforcement – Deepen your Confidence Building – Develop test-taking
understanding through strategies and reduce
evidence-based exam anxiety
rationales
Time Management – Practice answering
questions under simulated
exam conditions
Review Summary 190 Questions
Foundations - Application - WGU D388 Fundamentals OF Spreadsheets AND DATA Presentations
Objective Assessment OA V1 AND V2 AND 2026 Update 100 Correct Spreadsheets AND DATA
Presentations Undergraduate YEAR 2-3
All answers with rationales
,Table of Contents
Content Area Questions Key Topics
Spreadsheet Fundamentals 1-32 Sales, YOU NEED, Column, Dataset, Chart
Formulas AND Functions 33-64 Sales, YOU NEED, Formula, Product, Excel
DATA Visualization 65-96 YOU NEED, Sales, Chart, Excel, Dataset
DATA Analysis AND 97-128 Sales, YOU NEED, Excel, Column, Create
Organization
Charts AND Graphs 129-160 YOU NEED, Sales, Chart, Column, Formula
Conditional Formatting 161-190 Excel, Dataset, Chart, Appropriate, Sales
TOTAL 190 All questions include answers and detailed rationales
,Section A - Spreadsheet Fundamentals
Q1.
A dataset contains sales figures for the past five years, with one column for each month.
To compare annual trends while filtering out seasonality, which approach is most
appropriate?
A. Create a line chart of all monthly data B. Use a pivot table to aggregate monthly
points to observe the overall trend. data by year and create a bar chart of
annual totals.
C. Apply a moving average to the monthly D. Calculate the year-over-year percentage
data and chart the smoothed values. change for each month and chart the
results.
Correct: D - Calculate the year-over-year percentage change for each month and chart the
results.
Rationale:Year-over-year percentage change removes seasonality by comparing the same
month across years, revealing true growth trends. Options A and C mix seasonal and trend
components, while B only shows totals, hiding within-year patterns.
Q2.
In a spreadsheet, you need to sum all values in column B where the corresponding value
in column A is either 'Approved' or 'Pending'. Which formula correctly accomplishes this
without using array formulas?
A. =SUMIF(A:A,"Approved",B:B)+SUMIF(A: B. =SUMIFS(B:B,A:A,"Approved",A:A,"Pendi
A,"Pending",B:B) ng")
C. =SUMPRODUCT((A:A="Approved")+(A:A D. =SUM(IF((A:A="Approved")+(A:A="Pendi
="Pending"),B:B) ng"),B:B))
Correct: A - =SUMIF(A:A,"Approved",B:B)+SUMIF(A:A,"Pending",B:B)
Rationale:SUMIF can only test one condition, so two SUMIFs added together correctly sum
values meeting either criterion. SUMIFS requires all conditions to be true simultaneously,
making B impossible. C and D require array handling and are less straightforward.
Q3.
You are preparing a presentation for a non-technical audience to show the proportion of
total sales by product category. Which chart type is least appropriate?
A. Pie chart B. Stacked bar chart
C. 100% stacked column chart D. Scatter plot
Page 3
, Section A - Spreadsheet Fundamentals
Correct: D - Scatter plot
Rationale:Scatter plots are for showing relationships between two numerical variables, not for
part-to-whole comparisons. Pie, stacked bar, and 100% stacked column charts all effectively
display proportions of a whole.
Q4.
A spreadsheet contains a column of dates as text in the format 'MM/DD/YYYY'. You need to
convert these to actual date values. Which function or feature is most efficient for this
conversion?
A. Use the DATEVALUE function in a new B. Use the Text to Columns wizard with a
column date delimiter
C. Use the VALUE function directly on the D. Use the DATE function with MID and
text LEFT to parse components
Correct: A - Use the DATEVALUE function in a new column
Rationale:DATEVALUE converts a date text string into a serial number, and it's the direct
function for this task. Text to Columns can work but is multi-step. VALUE may fail with certain
date formats, and DATE with MID/LEFT is unnecessarily complex.
Q5.
You have a large dataset with duplicate records. Which method is most reliable for
identifying duplicates based on multiple columns (e.g., Customer ID and Order Date)
without deleting data?
A. Conditional formatting to highlight B. Use the Remove Duplicates feature on
duplicate values in each column separately the selected columns
C. Create a helper column concatenating D. Sort the data by the key columns and
the key columns and then use COUNTIF to visually scan for repeats
flag duplicates
Correct: C - Create a helper column concatenating the key columns and then use
COUNTIF to flag duplicates
Rationale:Concatenating key columns and using COUNTIF accurately flags duplicates based
on combined criteria. Conditional formatting on single columns misses multi-column
duplicates. Remove Duplicates deletes data, and visual scanning is error-prone.
Q6.
A financial model uses a discount rate that changes over time. To calculate the net present
value of a series of cash flows with varying discount rates per period, which approach is
correct?
Page 4
SPREADSHEETS AND DATA
PRESENTATIONS OBJECTIVE
PRENIUM EXAM
190 Questions with Answers and Detailed Rationales
100 PERCENT GUARANTEED PASS
INSTANT DOWNLOAD ANSWERS INCLUDED
IMPORTANCE OF THIS DOCUMENT
This comprehensive examination preparation guide has been meticulously developed to help you succeed in the
WGU D388 FUNDAMENTALS OF SPREADSHEETS AND DATA PRESENTATIONS OBJECTIVE ASSESSMENT
| OA V1 AND V2 | QUESTIONS AND ANSWERS | 2026 UPDATE | 100% CORRECT.. It contains 190 carefully
selected questions that reflect the most current exam content and testing strategies. Each question is
accompanied by a correct answer and a detailed rationale that explains the underlying pathophysiology,
pharmacology, or clinical reasoning.
Self-Assessment – Test your knowledge and Exam Preparation – Familiarize yourself with the
identify areas requiring further question format and content
study areas
Concept Reinforcement – Deepen your Confidence Building – Develop test-taking
understanding through strategies and reduce
evidence-based exam anxiety
rationales
Time Management – Practice answering
questions under simulated
exam conditions
Review Summary 190 Questions
Foundations - Application - WGU D388 Fundamentals OF Spreadsheets AND DATA Presentations
Objective Assessment OA V1 AND V2 AND 2026 Update 100 Correct Spreadsheets AND DATA
Presentations Undergraduate YEAR 2-3
All answers with rationales
,Table of Contents
Content Area Questions Key Topics
Spreadsheet Fundamentals 1-32 Sales, YOU NEED, Column, Dataset, Chart
Formulas AND Functions 33-64 Sales, YOU NEED, Formula, Product, Excel
DATA Visualization 65-96 YOU NEED, Sales, Chart, Excel, Dataset
DATA Analysis AND 97-128 Sales, YOU NEED, Excel, Column, Create
Organization
Charts AND Graphs 129-160 YOU NEED, Sales, Chart, Column, Formula
Conditional Formatting 161-190 Excel, Dataset, Chart, Appropriate, Sales
TOTAL 190 All questions include answers and detailed rationales
,Section A - Spreadsheet Fundamentals
Q1.
A dataset contains sales figures for the past five years, with one column for each month.
To compare annual trends while filtering out seasonality, which approach is most
appropriate?
A. Create a line chart of all monthly data B. Use a pivot table to aggregate monthly
points to observe the overall trend. data by year and create a bar chart of
annual totals.
C. Apply a moving average to the monthly D. Calculate the year-over-year percentage
data and chart the smoothed values. change for each month and chart the
results.
Correct: D - Calculate the year-over-year percentage change for each month and chart the
results.
Rationale:Year-over-year percentage change removes seasonality by comparing the same
month across years, revealing true growth trends. Options A and C mix seasonal and trend
components, while B only shows totals, hiding within-year patterns.
Q2.
In a spreadsheet, you need to sum all values in column B where the corresponding value
in column A is either 'Approved' or 'Pending'. Which formula correctly accomplishes this
without using array formulas?
A. =SUMIF(A:A,"Approved",B:B)+SUMIF(A: B. =SUMIFS(B:B,A:A,"Approved",A:A,"Pendi
A,"Pending",B:B) ng")
C. =SUMPRODUCT((A:A="Approved")+(A:A D. =SUM(IF((A:A="Approved")+(A:A="Pendi
="Pending"),B:B) ng"),B:B))
Correct: A - =SUMIF(A:A,"Approved",B:B)+SUMIF(A:A,"Pending",B:B)
Rationale:SUMIF can only test one condition, so two SUMIFs added together correctly sum
values meeting either criterion. SUMIFS requires all conditions to be true simultaneously,
making B impossible. C and D require array handling and are less straightforward.
Q3.
You are preparing a presentation for a non-technical audience to show the proportion of
total sales by product category. Which chart type is least appropriate?
A. Pie chart B. Stacked bar chart
C. 100% stacked column chart D. Scatter plot
Page 3
, Section A - Spreadsheet Fundamentals
Correct: D - Scatter plot
Rationale:Scatter plots are for showing relationships between two numerical variables, not for
part-to-whole comparisons. Pie, stacked bar, and 100% stacked column charts all effectively
display proportions of a whole.
Q4.
A spreadsheet contains a column of dates as text in the format 'MM/DD/YYYY'. You need to
convert these to actual date values. Which function or feature is most efficient for this
conversion?
A. Use the DATEVALUE function in a new B. Use the Text to Columns wizard with a
column date delimiter
C. Use the VALUE function directly on the D. Use the DATE function with MID and
text LEFT to parse components
Correct: A - Use the DATEVALUE function in a new column
Rationale:DATEVALUE converts a date text string into a serial number, and it's the direct
function for this task. Text to Columns can work but is multi-step. VALUE may fail with certain
date formats, and DATE with MID/LEFT is unnecessarily complex.
Q5.
You have a large dataset with duplicate records. Which method is most reliable for
identifying duplicates based on multiple columns (e.g., Customer ID and Order Date)
without deleting data?
A. Conditional formatting to highlight B. Use the Remove Duplicates feature on
duplicate values in each column separately the selected columns
C. Create a helper column concatenating D. Sort the data by the key columns and
the key columns and then use COUNTIF to visually scan for repeats
flag duplicates
Correct: C - Create a helper column concatenating the key columns and then use
COUNTIF to flag duplicates
Rationale:Concatenating key columns and using COUNTIF accurately flags duplicates based
on combined criteria. Conditional formatting on single columns misses multi-column
duplicates. Remove Duplicates deletes data, and visual scanning is error-prone.
Q6.
A financial model uses a discount rate that changes over time. To calculate the net present
value of a series of cash flows with varying discount rates per period, which approach is
correct?
Page 4