

Statistics Assignment 1 Group 110
Question 1
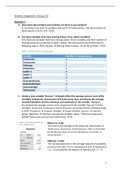
A. How many observations and variables are there in your dataset?
In our dataset we have 33 variables with each 172 observations. The total number of
observations is (172 x 33) = 5676.
B. Are there variables that have missing values? If so, which variables?
Yes, there are variables that have missing values. These variables and their number of
missing values are presented in table 1 below. We obtained this by performing the
following steps in SPSS: Analyze à Missing Value Analysis à Use All Variables à OK
Table 1: Variables and their missing values
Variable Number of missing values
Ecolsuccess 5
Econsuccess 5
Followup 1
Knowshare 6
Leader 1 8
Leader 2 8
Leader 3 8
OutcomeIncome 4
OutcomeProduct 4
Susknowledge 1
Techsuccess 5
C. Create a new variable “Success”. It should reflect the average success score of the
variables Techsuccess, Econsuccess and Ecolsuccess. Give and discuss the average,
standard deviation and the minimum and maximum of the variable “Success”.
To compute the average success score (expressed in the variable “Success”) of the
variables Techsucces, Econsuccess and Ecolsuccess, we performed the following steps
in SPSS: Transform à Compute Variable à Target Variable: Success à Function
group: Statistical à Functions and special variables: Mean à Numeric Expression:
MEAN(Techsuccess,Econsuccess,Ecolsuccess) à OK
Table 2: Descriptive statistics of Mean ( ) = 6,36
the variable Success
The mean is the average of the values per observation of
Techsuccess, Econsucces and Ecolsucces. This is calculated
by the Σscores (Sum of scores) divided by n (number of
observations).
Stdev (s) = 1,813
The standard deviation is the average amount of variability
present in the data. This is calculated by Sum of Squares (SS
= (𝑥 - )2) divided by the degrees of freedom (df = n – 1)
1
, Minimum = 1 and Maximum = 10
The minimum and maximum are the lowest and highest scores given per
observations. There are no values that go beyond the minimum and maximum.
We can discuss that the mean (= 6.36) is above ‘average’ (= 5) of the maximum and
minimum, because the maximum = 10 and the minimum = 1, which is positive. We
also noticed that there is a fairly large standard deviation (= 1.813, in a maximum
range 1-10). This indicates that there is a high amount of variety present in the
variable Success.
D. Create a table for the variable TechTop that provides insights in the distribution of
this variable
To create a table that provides insights in the distribution of Techtop, we performed
the following steps in SPSS: Analyze à Descriptive Statistics à Frequency Table à
Variables: Techtop à OK
Table 3: Representation of distribution of the variable Techtop
As seen in table 3 there are 6 topics in total (100%). The first (Wind energy) and sixth
(Plastic reduction) topic both have a percentage of 18%. The third (Agro technology)
topic has the highest percentage of 19.8%. The fifth (Circular fashion) has the lowest
percentage (12.2%) followed by the fourth (Built environment) topic (13.4%). It is also
clear that topic 1 (Wind energy; 18%), 2 (Solar energy; 18.6%) and 6 (Plastic
reduction; 18%) have a fairly similar
percentage.
On basis of these percentages, we can
conclude that TechTop is not fully normally
distributed (see also figure 1). Normally
distributed data should have a bell-shape and
the percentages on both left and right sides
should be similar.
Figure 1: Distribution of Techtop
2
Question 1
A. How many observations and variables are there in your dataset?
In our dataset we have 33 variables with each 172 observations. The total number of
observations is (172 x 33) = 5676.
B. Are there variables that have missing values? If so, which variables?
Yes, there are variables that have missing values. These variables and their number of
missing values are presented in table 1 below. We obtained this by performing the
following steps in SPSS: Analyze à Missing Value Analysis à Use All Variables à OK
Table 1: Variables and their missing values
Variable Number of missing values
Ecolsuccess 5
Econsuccess 5
Followup 1
Knowshare 6
Leader 1 8
Leader 2 8
Leader 3 8
OutcomeIncome 4
OutcomeProduct 4
Susknowledge 1
Techsuccess 5
C. Create a new variable “Success”. It should reflect the average success score of the
variables Techsuccess, Econsuccess and Ecolsuccess. Give and discuss the average,
standard deviation and the minimum and maximum of the variable “Success”.
To compute the average success score (expressed in the variable “Success”) of the
variables Techsucces, Econsuccess and Ecolsuccess, we performed the following steps
in SPSS: Transform à Compute Variable à Target Variable: Success à Function
group: Statistical à Functions and special variables: Mean à Numeric Expression:
MEAN(Techsuccess,Econsuccess,Ecolsuccess) à OK
Table 2: Descriptive statistics of Mean ( ) = 6,36
the variable Success
The mean is the average of the values per observation of
Techsuccess, Econsucces and Ecolsucces. This is calculated
by the Σscores (Sum of scores) divided by n (number of
observations).
Stdev (s) = 1,813
The standard deviation is the average amount of variability
present in the data. This is calculated by Sum of Squares (SS
= (𝑥 - )2) divided by the degrees of freedom (df = n – 1)
1
, Minimum = 1 and Maximum = 10
The minimum and maximum are the lowest and highest scores given per
observations. There are no values that go beyond the minimum and maximum.
We can discuss that the mean (= 6.36) is above ‘average’ (= 5) of the maximum and
minimum, because the maximum = 10 and the minimum = 1, which is positive. We
also noticed that there is a fairly large standard deviation (= 1.813, in a maximum
range 1-10). This indicates that there is a high amount of variety present in the
variable Success.
D. Create a table for the variable TechTop that provides insights in the distribution of
this variable
To create a table that provides insights in the distribution of Techtop, we performed
the following steps in SPSS: Analyze à Descriptive Statistics à Frequency Table à
Variables: Techtop à OK
Table 3: Representation of distribution of the variable Techtop
As seen in table 3 there are 6 topics in total (100%). The first (Wind energy) and sixth
(Plastic reduction) topic both have a percentage of 18%. The third (Agro technology)
topic has the highest percentage of 19.8%. The fifth (Circular fashion) has the lowest
percentage (12.2%) followed by the fourth (Built environment) topic (13.4%). It is also
clear that topic 1 (Wind energy; 18%), 2 (Solar energy; 18.6%) and 6 (Plastic
reduction; 18%) have a fairly similar
percentage.
On basis of these percentages, we can
conclude that TechTop is not fully normally
distributed (see also figure 1). Normally
distributed data should have a bell-shape and
the percentages on both left and right sides
should be similar.
Figure 1: Distribution of Techtop
2

