

Statistics Assignment 2 Group 110
Question 1
A. Do the technological topics differ significantly on Publ and Media at 𝜶 = 5%?
To determine if the technological topics differ significantly on Publ and Media we
need to perform a one-way ANOVA test. We perform this test, because we are
dealing with more than two independent groups (technological topics; N=6).
Hypotheses Publ
H0 = there is no statistically significance difference between Publ and the
technological groups
H1 = there is a statistically significance difference between Publ and the technological
groups
Hypotheses Media
H0 = there is no statistically significance difference between Media and the
technological groups
H1 = there is a statistically significance difference between Media and the
technological groups
To calculate the exceedance probability, and thus to determine whether
technological topics differ significantly on Publ and Media, we performed the
following steps in SPSS: Analyze à Compare Means à One-way ANOVA à
Dependent variable: Publ and Media, Fixed factors: Techtop à OK
The SPSS output of the performed one-way ANOVAs of Techtop on the variables Publ
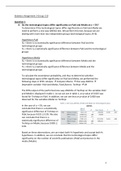
and Media is displayed in table 1. As we can see in table 1, an p-value of 0.025 was
found for Techtop on Publ. In addition, we can see that an p-value of 0.000 was
observed for the variables Media on Techtop.
Table 1: One-way ANOVA of Publ and Media on technological topics
In the case of 𝛼 = 5%, we can
conclude that there is a statistically
significance difference of Techtop on
Publ, because 0.025 ≤ 0.05. We also
can conclude that there is a
statistically significance difference of
Techtop on Media, because 0.000 ≤
0.05.
Based on these observations, we can reject both H0 hypothesis and accept both H1
hypotheses. In addition, we can conclude that the technological topics differ
significantly on the number of scientific publications (Publ) and presence in the
media (Media).
1
, B. Express the strength of the differences of question 1A in a measurement. Show
your calculations and interpret the results.
To determine the strength of the differences, we need to calculate eta2 for the
variables Publ and Media. We use eta2, because we need to know what the
proportion of variation in Y (Publ and Media) is explained by X (technological groups)
in the sample.
We used the following formula to calculate the strength of the differences:
!!"#$%##&
eta2 = !!$'$()
Publ
SSbetween = 1043.244 (see table 1)
SStotal = 14132.297 (see table 1)
!"#$.&##
eta2 = = 0.074
!#!$&.&'(
Media
SSbetween = 17685.161 (see table 1)
SStotal = 118342.762 (see table 1)
!()*+.!)!
eta2 = !!*$#&.()& = 0.149
For Publ an eta2 of 0.074 was found. If we look at Appendix 4: Effect sizes, we can
conclude that this is a medium difference/effect, because 0.06 ≤ 0.074 ≤ 0.14. This
indicates that 7.4% of the proportion of variation in Publ is explained by Techtop.
For Media an eta2 of 0.149 was found. According to Appendix 4: Effect sizes, we can
conclude that this is a large difference/effect, because 0.149 ≥ 0.14. This indicates
that 14.9% of the proportion of variation in Media is explained by Techtop.
C. Which technological topics differ significantly? Describe both output tables of the
post-hoc Tukey analysis (𝜶 = 5%) in your answer. Choose a significant ANOVA.
In our case, both ANOVAs were significant. However, we need to choose one ANOVA
to determine which technological topics differ significantly. We decided to choose
the ANOVA concerning Media, because the founded statistically significance
difference had a large effect in comparison with Publ, where the difference had a
medium-sized effect.
We performed a post-hoc Tukey test in SPSS: Analyze à Compare Means à One-
way ANOVA à Dependent variable: Media, Fixed factors: Techtop à Post-hoc: Tukey
à OK
2
Question 1
A. Do the technological topics differ significantly on Publ and Media at 𝜶 = 5%?
To determine if the technological topics differ significantly on Publ and Media we
need to perform a one-way ANOVA test. We perform this test, because we are
dealing with more than two independent groups (technological topics; N=6).
Hypotheses Publ
H0 = there is no statistically significance difference between Publ and the
technological groups
H1 = there is a statistically significance difference between Publ and the technological
groups
Hypotheses Media
H0 = there is no statistically significance difference between Media and the
technological groups
H1 = there is a statistically significance difference between Media and the
technological groups
To calculate the exceedance probability, and thus to determine whether
technological topics differ significantly on Publ and Media, we performed the
following steps in SPSS: Analyze à Compare Means à One-way ANOVA à
Dependent variable: Publ and Media, Fixed factors: Techtop à OK
The SPSS output of the performed one-way ANOVAs of Techtop on the variables Publ
and Media is displayed in table 1. As we can see in table 1, an p-value of 0.025 was
found for Techtop on Publ. In addition, we can see that an p-value of 0.000 was
observed for the variables Media on Techtop.
Table 1: One-way ANOVA of Publ and Media on technological topics
In the case of 𝛼 = 5%, we can
conclude that there is a statistically
significance difference of Techtop on
Publ, because 0.025 ≤ 0.05. We also
can conclude that there is a
statistically significance difference of
Techtop on Media, because 0.000 ≤
0.05.
Based on these observations, we can reject both H0 hypothesis and accept both H1
hypotheses. In addition, we can conclude that the technological topics differ
significantly on the number of scientific publications (Publ) and presence in the
media (Media).
1
, B. Express the strength of the differences of question 1A in a measurement. Show
your calculations and interpret the results.
To determine the strength of the differences, we need to calculate eta2 for the
variables Publ and Media. We use eta2, because we need to know what the
proportion of variation in Y (Publ and Media) is explained by X (technological groups)
in the sample.
We used the following formula to calculate the strength of the differences:
!!"#$%##&
eta2 = !!$'$()
Publ
SSbetween = 1043.244 (see table 1)
SStotal = 14132.297 (see table 1)
!"#$.&##
eta2 = = 0.074
!#!$&.&'(
Media
SSbetween = 17685.161 (see table 1)
SStotal = 118342.762 (see table 1)
!()*+.!)!
eta2 = !!*$#&.()& = 0.149
For Publ an eta2 of 0.074 was found. If we look at Appendix 4: Effect sizes, we can
conclude that this is a medium difference/effect, because 0.06 ≤ 0.074 ≤ 0.14. This
indicates that 7.4% of the proportion of variation in Publ is explained by Techtop.
For Media an eta2 of 0.149 was found. According to Appendix 4: Effect sizes, we can
conclude that this is a large difference/effect, because 0.149 ≥ 0.14. This indicates
that 14.9% of the proportion of variation in Media is explained by Techtop.
C. Which technological topics differ significantly? Describe both output tables of the
post-hoc Tukey analysis (𝜶 = 5%) in your answer. Choose a significant ANOVA.
In our case, both ANOVAs were significant. However, we need to choose one ANOVA
to determine which technological topics differ significantly. We decided to choose
the ANOVA concerning Media, because the founded statistically significance
difference had a large effect in comparison with Publ, where the difference had a
medium-sized effect.
We performed a post-hoc Tukey test in SPSS: Analyze à Compare Means à One-
way ANOVA à Dependent variable: Media, Fixed factors: Techtop à Post-hoc: Tukey
à OK
2

