WGU D372
Task 1 Dylan
Chrislip
A1: Scenario: victor and Victoria grew up in rural Vermont. Their parents
had Acres of land that gave them access to the resources Victor and Victoria
would need to grow and sell food. Thus began their organic food company
named “Victoria's Bramble”. Her Bramble became increasingly popular,
causing demand for their products to grow.
Pattern: After gaining popularity and their customer base grew, demand
rose for Victoria’s Bramble’s organic food. They decided to use money from
their savings to lease farmland to increase their production. With the
increase in production came the need for additional equipment, a new barn,
and more power. They decided to use a credit card causing their debt to
increase exponentially.
Structure: Victoria's Bramble increased their debt to the point where they
could no longer make a profit nor pay their debt down.
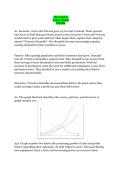
A2. The graph that best describes the events, patterns, and structure is
graph number two.
A2a. Graph number two shows the promising growth of sales and profit
before expanding their operation. As debt begins to grow, from purchasing
new equipment, land, a barn, and increasing power, you can see them
Task 1 Dylan
Chrislip
A1: Scenario: victor and Victoria grew up in rural Vermont. Their parents
had Acres of land that gave them access to the resources Victor and Victoria
would need to grow and sell food. Thus began their organic food company
named “Victoria's Bramble”. Her Bramble became increasingly popular,
causing demand for their products to grow.
Pattern: After gaining popularity and their customer base grew, demand
rose for Victoria’s Bramble’s organic food. They decided to use money from
their savings to lease farmland to increase their production. With the
increase in production came the need for additional equipment, a new barn,
and more power. They decided to use a credit card causing their debt to
increase exponentially.
Structure: Victoria's Bramble increased their debt to the point where they
could no longer make a profit nor pay their debt down.
A2. The graph that best describes the events, patterns, and structure is
graph number two.
A2a. Graph number two shows the promising growth of sales and profit
before expanding their operation. As debt begins to grow, from purchasing
new equipment, land, a barn, and increasing power, you can see them