Summery statistics 3 clinical tract
In this summery information mentioned before is not necessarily repeated
Warner (2020) and Agresti and Finlay (2013) are used as literature.
Lecture 1
Important matters for the application of statistics (“Applied Statistics”):
- Selecting a sample from a population
- Deciding whether a sample is representative
- Descriptive or inferential statistics
- Measurement levels (NOIR) and types of variables (categorical/quantitative)
- Selecting the correct statistical analysis (focus of statistic 3)
- Experimental versus non-experimental research design
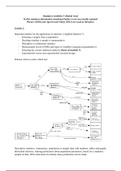
Schema when to select which test:
Descriptive statistics: summarizes population or sample data with numbers, tables and graphs
Inferential statistics: making predictions about population parameters, based on a (random)
sample of data. With what kind of certainty these predictions can be made.
,Population: total set of participant relevant for the research question
Sample: a subset of the population about who the data is collected
Reliability (precision): after repeated measures similar results (reliable). Large sample more
precise as a small sample.
Validity (bias): to what extend the sample a representation is of the population.
Measurement scales (NOIR):
- Categorical/qualitative
o Nominal: unordered categories
o Ordinal: ordered categories
- Quantitative/numerical
o Interval: equal distance between consecutive values (°C)
o Ratio: equal distance and true zero point (K)
Range:
- Discrete: individual measurement unite. No answers that aren’t whole (number of
brothers/ sisters)
- Continuous: infinitely divisible measurement unit (with decimals)
3 important dimensions in descriptive statistics:
- Central tendency (typical observation): mean mode median
- Dispersion (variability in observations): standard deviation, variance, interquartile
range
- Position (relative position of the observations): percentile, quartile etc.
In descriptive statistics there are no uncertainties.
Sample problems with inferential statistics:
- Sampling error: natural (random) sampling variation (standard error). Can be
overcome by a confidents interval (for example 95%)
- Sampling bias: selective sampling
- Response bias: incorrect answer. Can be because of shame, obstructive behaviour or a
question that is difficult.
, - Non-Response bias: selective participation
Solution: A random (or other probability) sampling approach of sufficient size that generates
data for everyone approached, with correct responses on all items for all subjects.
Dimensions of distribution:
- Population distribution: distribution of the population
- Sample data distribution: distribution of the sample
- Sampling distribution: The probability distribution for the sample statistic
(proportion/mean/regression coefficient). To interpret as the result of repetitive taking
of a sample of size n.
π (1−π )
o Standard deviation:
√ n
o Standard error (σM) estimated by SEM
Larger sample lower standard error
Central Limit Theorem for sampling distribution: eventually all sampling distributions will
become a normal distribution.
- With a population distribution that is a normal distribution even with a small sample
the sampling distribution will be a normal distribution.
- With a population distribution that is skewed there will be a sampling distribution that
is a normal distribution with a large enough sample.
Empirical rule for normal distribution:
- 68% within ± 1𝜎 of the mean
- 95% within ± 2𝜎 of the mean
- almost 100% within ± 3𝜎 of the mean
Types of probability distributions:
- (Standard) normal distribution z-statistic
o Sampling distribution for proportion(s) when H0 holds.
o (Sampling distribution for mean when H0 holds and when the population
standard deviation is known)
- Student’s T distribution(s) t-statistic
o Sampling distribution for mean when H0 holds and when the population
standard deviation is unknown.
o Sampling distribution for regression coefficient(s) when H0 holds.
o Small sample t-distribution less like z-distribution
o Large sample t-distribution almost exactly like z-distribution (wider tails)
- Chi square distribution(s) χ2-statistic
o Sampling distribution for squared deviations (in frequencies)
of categorical variables when H0 holds.
o Skewed to the right, table works like t-table
- Fisher’s distribution(s) F-statistic
, o Sampling distribution for ANOVA omnibus test of
means when H0 holds
o Skewed to the right, table works like t-table
5 steps of a hypothesis test:
- Defining assumptions
- Set up hypothesis
- Calculate test-statistic (e.g. t-value)
- Determine p-value (p < 0.05 zekerder om H0 te verwerpen)
- Draw conclusion
Type 1 error (alpha): false positive (pregnant men). You reject H0 where it would be correct
to not reject H0. Depends on the chosen significance level.
Type 2 error (Beta): false negative. You do not reject H0 where it would be correct to reject
H0. Depends on:
- Effect size: large true effect size overlapping area becomes smaller reduces type
2 error
- Sample size: larger distributions smaller improved power/ reduced type 2 error
- Variance in the sample.
Smaller the chosen type 1 error larger type 2 error
Talking about population statistics Greek letters
Significance level: P-value, type 1 error, alpha
Power: 1- beta, probability to draw the correct conclusion
Sample size: n
Effect size: d, larger difference true state in the world and the H0 larger effect size.
When the effect size drops below the critical value the H0 cannot be rejected (type 2 error).
In this summery information mentioned before is not necessarily repeated
Warner (2020) and Agresti and Finlay (2013) are used as literature.
Lecture 1
Important matters for the application of statistics (“Applied Statistics”):
- Selecting a sample from a population
- Deciding whether a sample is representative
- Descriptive or inferential statistics
- Measurement levels (NOIR) and types of variables (categorical/quantitative)
- Selecting the correct statistical analysis (focus of statistic 3)
- Experimental versus non-experimental research design
Schema when to select which test:
Descriptive statistics: summarizes population or sample data with numbers, tables and graphs
Inferential statistics: making predictions about population parameters, based on a (random)
sample of data. With what kind of certainty these predictions can be made.
,Population: total set of participant relevant for the research question
Sample: a subset of the population about who the data is collected
Reliability (precision): after repeated measures similar results (reliable). Large sample more
precise as a small sample.
Validity (bias): to what extend the sample a representation is of the population.
Measurement scales (NOIR):
- Categorical/qualitative
o Nominal: unordered categories
o Ordinal: ordered categories
- Quantitative/numerical
o Interval: equal distance between consecutive values (°C)
o Ratio: equal distance and true zero point (K)
Range:
- Discrete: individual measurement unite. No answers that aren’t whole (number of
brothers/ sisters)
- Continuous: infinitely divisible measurement unit (with decimals)
3 important dimensions in descriptive statistics:
- Central tendency (typical observation): mean mode median
- Dispersion (variability in observations): standard deviation, variance, interquartile
range
- Position (relative position of the observations): percentile, quartile etc.
In descriptive statistics there are no uncertainties.
Sample problems with inferential statistics:
- Sampling error: natural (random) sampling variation (standard error). Can be
overcome by a confidents interval (for example 95%)
- Sampling bias: selective sampling
- Response bias: incorrect answer. Can be because of shame, obstructive behaviour or a
question that is difficult.
, - Non-Response bias: selective participation
Solution: A random (or other probability) sampling approach of sufficient size that generates
data for everyone approached, with correct responses on all items for all subjects.
Dimensions of distribution:
- Population distribution: distribution of the population
- Sample data distribution: distribution of the sample
- Sampling distribution: The probability distribution for the sample statistic
(proportion/mean/regression coefficient). To interpret as the result of repetitive taking
of a sample of size n.
π (1−π )
o Standard deviation:
√ n
o Standard error (σM) estimated by SEM
Larger sample lower standard error
Central Limit Theorem for sampling distribution: eventually all sampling distributions will
become a normal distribution.
- With a population distribution that is a normal distribution even with a small sample
the sampling distribution will be a normal distribution.
- With a population distribution that is skewed there will be a sampling distribution that
is a normal distribution with a large enough sample.
Empirical rule for normal distribution:
- 68% within ± 1𝜎 of the mean
- 95% within ± 2𝜎 of the mean
- almost 100% within ± 3𝜎 of the mean
Types of probability distributions:
- (Standard) normal distribution z-statistic
o Sampling distribution for proportion(s) when H0 holds.
o (Sampling distribution for mean when H0 holds and when the population
standard deviation is known)
- Student’s T distribution(s) t-statistic
o Sampling distribution for mean when H0 holds and when the population
standard deviation is unknown.
o Sampling distribution for regression coefficient(s) when H0 holds.
o Small sample t-distribution less like z-distribution
o Large sample t-distribution almost exactly like z-distribution (wider tails)
- Chi square distribution(s) χ2-statistic
o Sampling distribution for squared deviations (in frequencies)
of categorical variables when H0 holds.
o Skewed to the right, table works like t-table
- Fisher’s distribution(s) F-statistic
, o Sampling distribution for ANOVA omnibus test of
means when H0 holds
o Skewed to the right, table works like t-table
5 steps of a hypothesis test:
- Defining assumptions
- Set up hypothesis
- Calculate test-statistic (e.g. t-value)
- Determine p-value (p < 0.05 zekerder om H0 te verwerpen)
- Draw conclusion
Type 1 error (alpha): false positive (pregnant men). You reject H0 where it would be correct
to not reject H0. Depends on the chosen significance level.
Type 2 error (Beta): false negative. You do not reject H0 where it would be correct to reject
H0. Depends on:
- Effect size: large true effect size overlapping area becomes smaller reduces type
2 error
- Sample size: larger distributions smaller improved power/ reduced type 2 error
- Variance in the sample.
Smaller the chosen type 1 error larger type 2 error
Talking about population statistics Greek letters
Significance level: P-value, type 1 error, alpha
Power: 1- beta, probability to draw the correct conclusion
Sample size: n
Effect size: d, larger difference true state in the world and the H0 larger effect size.
When the effect size drops below the critical value the H0 cannot be rejected (type 2 error).