Página 2 fuera de 15 resultados
Ordenador por
-
Week 7
- Resumen • 3 páginas • 2023
- 9,94 €
- + aprende más y mejor
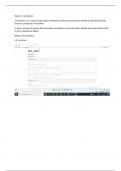
The text is Mastering Spark with R. Using the sc connection that you have built earlier and making sure that you are still using Java 8, install the corr library and execute the following lines of code: >ml_corr(cars) >correlate(cars, use = "", method = "pearson" >correlate(cars, use = "", method = "pearson" %>% shave() %>% rplot() Submit a Word doc with screenshots of the results of running the code. Explain what the chart is showing. Expl...
-
Week 6
- Resumen • 3 páginas • 2023
- 9,94 €
- + aprende más y mejor
The text is Mastering Spark with R. Using the sc connection with Java 8, execute the following lines of code: >summarize(cars, mpg_percentile = percentile(mpg, 0.25) >summarize(cars, mpg_percentile = percentile(mpg, 0.25) %>% show_query() >summarize(cars, mpg_percentile = percentile(mpg, array(0.25, 0.5, 0.75) )) >summarize(cars, mpg_percentile = percentile(mpg, array(0.25, 0.5, 0.75) )) %>% mutate(mpg_percentile = explode(mpg_percentile))
-
Week 10
- Resumen • 3 páginas • 2023
- 9,94 €
- + aprende más y mejor
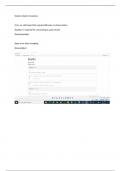
Follow the instructions in the book in Chapter 4 to read in the okc data. Explain what each element in the code is doing. Glimpse() the data. ANSWER THESE QUESTIONS; 1.What is the data type of the essay fields? 2.What do they contain? 3.How do you know the data is in Spark? Continue to use the code in Chapter 4 to add a response variable. ANSWER THESE QUESTIONS: 4. What is the response variable added? 5. Explain how the response variable is aggregated. 6. What is the tally? Continue t...
-
Week 3
- Resumen • 2 páginas • 2023
- 9,94 €
- + aprende más y mejor
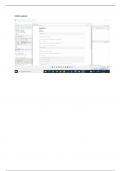
The text is Mastering Spark with R. After installing the dplyr library, use the following code in R studio, create a scatter plot of hp v. mpg cars2 <- copy_to(sc, mtcars) cars3 <- (cars2) cars4 <- select(cars3, hp, mpg) cars5 <- sample_n(cars4, 32) cars6 <- collect(cars5) plot(cars6)
-
Week 1
- Resumen • 1 páginas • 2023
- 9,94 €
- + aprende más y mejor
Submit a Word or .pdf document with screen shots of R Studio where you have created a vector of three words. Whenever you are asked to submit a screenshot, include either a sliver of your desktop or a timestamp from your desktop. Always repeat the question you are answering.
