
Proponents of Fibonacci analysis believe that because financial markets are influenced by human
behavior, which is part of nature, the same patterns and ratios can also be reflected in market
price movements. Traders use ratios derived from these numbers, such as Fibonacci retracement
levels (23.6%, 38.2%, 50%, 61.8%, and 78.6%) and Fibonacci extensions (127.2%, 161.8%, 261.8%,
etc.), to identify potential support and resistance levels and price targets.
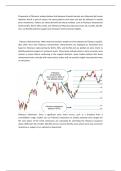
Fibonacci Retracements. When technical analysis newbies are first exposed to Fibonacci studies,
they often start with Fibonacci retracements. Retracements are displayed as horizontal lines
based on Fibonacci ratios (primarily 38.2%, 50%, and 61.8%) and are plotted on price charts to
identify potential support or resistance levels. These levels indicate where a price correction may
reverse or pause before continuing in the original direction. Some traders believe that these
retracement levels coincide with natural price action and can provide insight into potential entry
or exit points.
Fibonacci Extensions: Once a significant price move occurs, such as a breakout from a
consolidation range, traders can use Fibonacci extensions to predict potential price targets for
the next phase of the trend. Extensions are calculated by stretching the Fibonacci sequence
above 100% (127.2%, 161.8%, 261.8%) and are used to identify areas where price may encounter
resistance or support in an uptrend or downtrend.


