Histogram Study guides, Study notes & Summaries
Looking for the best study guides, study notes and summaries about Histogram? On this page you'll find 3149 study documents about Histogram.
Page 2 out of 3.149 results
Sort by
-
SPSS stappenplan voor tentamen
- Summary • 11 pages • 2024
- Available in package deal
-
- R156,52
- 10x sold
- + learn more
Hierin staan alle stappen beschreven voor alle dingen die je moet doen voor het tentamen van statistiek

-
Text_Analytics_Week12_NEC_Solved
- Exam (elaborations) • 13 pages • 2023
- Available in package deal
-
- R204,21
- 2x sold
- + learn more
Using the attached files of around 3200 tweets per person, show a histogram (frequency distribution) of the tweets of both Dave and Julia. Use `UTC` to create the time stamp. Remember that the case of column headers matters. Make a dataframe of word frequency for each of Dave and Julia. Plot the frequencies against each other. Include a dividing line in red showing words nearby that are similar in frequency and words more distant which are shared less frequently. Create a stacked chart compa...
-
Marktonderzoek SPSS Samenvatting (+voorbeeldvragen)
- Summary • 48 pages • 2023
- Available in package deal
-
- R125,68
- 1x sold
- + learn more
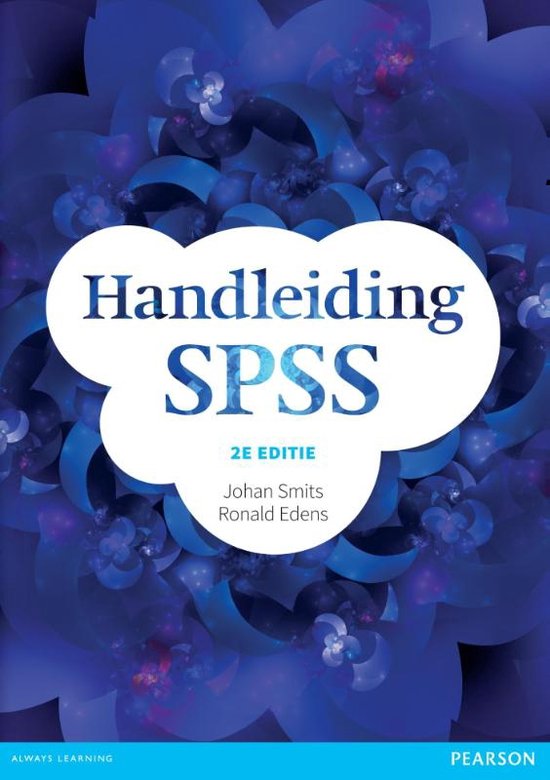
Samenvatting van Marktonderzoek SPSS. Deze samenvatting is gebaseerd op de lessen, powerpoints en het boek (Handboek handleiding SPSS van Smits & Edens). Op de beginpagina van het document vind je een inhoudsopgave met welke thema's deze samenvatting specifiek behandeld.
-
NSG-522 Midterm Questions And Answers
- Exam (elaborations) • 11 pages • 2023
-
- R233,42
- 1x sold
- + learn more
The frequency and relative frequency presented as a percentage should both be reported when describing interval level data - Answer- False What type of graphic display would be the best for a variable measured at the ordinal data? - Answer- Histogram The operational definition of a variable - Answer- Specifies how a variable should be measured The epidemiological range is - Answer- the minimum and maximum values When reporting the mean for a variable, what measure of spread should be...
-
WGU C955 - Pre Assessment Questions And Answers 2022/2023
- Exam (elaborations) • 18 pages • 2022
-
- R311,29
- 3x sold
- + learn more
What is 3/4 divided by 2/3? A) 9/8 B) 5/12 C) 5/7 D) 6/7 9/8 A county park has hiking paths with lengths of 1.05, 3.6, 3.17, and 2.2 miles. What is the total length, in miles, of hiking paths in the park? A) 9.02 miles B) 10.02 miles C) 10.12 miles D) 11.2 miles 10.02 miles If there are 2 tablespoons in 1 fluid ounce, how many tablespoons does the following calculation yield? 4 fl oz - 1.5 tbsp 0.5 tbsp 1 tbsp 2.5 tbsp 6.5 tbsp 6.5 tbsp Solve for X: X...
-
Teacher EPI Assessment Questions Latest Version Updated 2023-2024 100% Correct Answer
- Exam (elaborations) • 7 pages • 2023
-
- R369,69
- 1x sold
- + learn more
Teacher EPI Assessment Questions Latest Version Updated % Correct Answer Which of the following is characteristic of a single-exposure, common-vehicle outbreak? -------- Correct Answer --------- The epidemic curve has a normal distribution when plotted against the logarithm of time Explanation: Single-exposure, common-vehicle outbreaks involve a sudden, rapid increase in cases of disease that are limited to persons who share a common exposure. Additionally, few secondary cases develop amo...
-
C720 PA wgu exam |70 questions and answers.
- Exam (elaborations) • 29 pages • 2023
- Available in package deal
-
- R272,35
- 1x sold
- + learn more
A company that produces motors uses the following check sheet: Why would the company use this check sheet? To create a control chart to measure the engine assembly process To create a flow chart of the engine assembly process To develop a suppliers, inputs, process, outputs, customers (SIPOC) diagram To develop a Pareto chart identifying the root causes of engine defects To develop a Pareto chart identifying the root causes of engine defects Which aspect of quality is demonstrated...

-
PYC3704 EXAM PACK 2024
- Exam (elaborations) • 189 pages • 2023
- Available in package deal
-
- R52,76
- 12x sold
- + learn more
Oct/Nov 2015 QUESTION A N S PAGE NR S QUESTION ANS A N S PAGE NR 1. A psychological theory is best defined as - - - - - S 1. a set of observations of human behavior 2. postulated relationships among constructs 3. statistical inferences based on measurements 2 Study guide: P99-100 2. A master’s student in psychology plans to study human consciousness, following the recent publication of Watson's theory about the nature of consciousness. The main aim of th...

-
RSC2601 EXAM PACK 2024
- Exam (elaborations) • 238 pages • 2023
-
- R53,93
- 19x sold
- + learn more
RSC2601 – Research in Social Sciences 1 RSC2601 - Research in the Social Sciences EXAM PREPARATION This document is a compilation of past UNISA exam Questions and Answers, Assignment Questions and Answers, as well as Test Yourself Questions and Answers from Studyguide. Answers are motivated by a combination of: • Page references to the UNISA Study Guide: • Short summaries regarding the relevant topic(s) in question. Past exams covered are: • May/Jun 2011 • Oct/Nov...
-
Straighterline Introduction to Statistics Questions With Complete Solutions.
- Exam (elaborations) • 9 pages • 2023
-
- R204,21
- 1x sold
- + learn more
Four steps in the process of statistics correct answer: 1. Producing Data 2. Exploratory Data Analysis 3. Probability 4. Inference Categorical variable correct answer: places individuals into one of several groups Two types: nominal and ordinal Quantitative Variable correct answer: represents a measurement or a count Two types: Interval and ratio Nominal Variable correct answer: categorical variables where there is no natural order among the categories Ordinal variable corre...

R115 for your summary multiplied by 100 fellow students... Do the math: that's a lot of money! Don't be a thief of your own wallet and start uploading yours now. Discover all about earning on Stuvia


