MATH 225N Week 8 Assignment; Correlation Question-Answers
Question
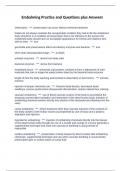
Which of the following data sets or plots could have a regression line with a
negative slope? Select all that apply.
Great work! That's correct.
the difference in the number of ships launched by competing ship builders as a
function of the number of months since the start of last year
the number of hawks sighted per day as a function of the number of days since the
two-week study started
the total number of ships launched by a ship builder as a function of the number of
months since the start of last year
the average number of hawks sighted per day in a series of studies as a function of
the number of days since the ten-week study started
Answer Explanation
,Correct answer:
the difference in the number of ships launched by competing ship builders as a
function of the number of months since the start of last year
the number of hawks sighted per day as a function of the number of days since the
two-week study started
the average number of hawks sighted per day in a series of studies as a function of
the number of days since the ten-week study started
The slope is related to the increase or decrease of the dependent variable as a
function of the independent variable. If the dependent variable can decrease, then
the slope can be negative, such as with the difference in the number of ships
launched.
Question
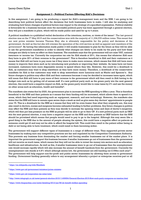
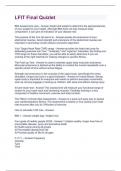
The scatter plot below shows the average cost of a designer jacket in a sample of
years between 2000 and 2015. The least squares regression line modeling this
data is given by yˆ=−4815+3.765x.
, A scatterplot has a horizontal axis labeled Year from 2005 to 2015 in increments of
5 and a vertical axis labeled Price ($) from 2660 to 2780 in increments of 20. The
following points are plotted: (2003, 2736); (2004, 2715); (2007, 2675); (2009, 2719);
(2013, 270). All coordinates are approximate.
Interpret the slope of the least squares regression line.
Yes that's right. Keep it up!
The average cost of a designer jacket decreased by $3.765 each year
between 2000 and 2015.
The average cost of a designer jacket increased by $3.765 each year
between 2000 and 2015.
The average cost of a designer jacket decreased by $4815 each year
between 2000 and 2015.
The average cost of a designer jacket increased by $4815 each year
between 2000 and 2015.
Answer Explanation
Correct answer:
The average cost of a designer jacket increased by $3.765 each year
between 2000 and 2015.
Since the slope of the line is positive 3.765, the average increase in cost
is $3.765 per year.
Question
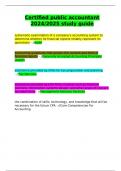
The scatter plot below shows data for the average cost of a high-end computer ( y,
in dollars) in the year x years since 2000. The least squares regression line is
given by yˆ=−1677+314x.
Question
Which of the following data sets or plots could have a regression line with a
negative slope? Select all that apply.
Great work! That's correct.
the difference in the number of ships launched by competing ship builders as a
function of the number of months since the start of last year
the number of hawks sighted per day as a function of the number of days since the
two-week study started
the total number of ships launched by a ship builder as a function of the number of
months since the start of last year
the average number of hawks sighted per day in a series of studies as a function of
the number of days since the ten-week study started
Answer Explanation
,Correct answer:
the difference in the number of ships launched by competing ship builders as a
function of the number of months since the start of last year
the number of hawks sighted per day as a function of the number of days since the
two-week study started
the average number of hawks sighted per day in a series of studies as a function of
the number of days since the ten-week study started
The slope is related to the increase or decrease of the dependent variable as a
function of the independent variable. If the dependent variable can decrease, then
the slope can be negative, such as with the difference in the number of ships
launched.
Question
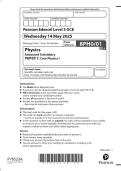
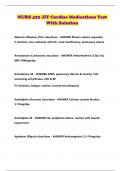
The scatter plot below shows the average cost of a designer jacket in a sample of
years between 2000 and 2015. The least squares regression line modeling this
data is given by yˆ=−4815+3.765x.
, A scatterplot has a horizontal axis labeled Year from 2005 to 2015 in increments of
5 and a vertical axis labeled Price ($) from 2660 to 2780 in increments of 20. The
following points are plotted: (2003, 2736); (2004, 2715); (2007, 2675); (2009, 2719);
(2013, 270). All coordinates are approximate.
Interpret the slope of the least squares regression line.
Yes that's right. Keep it up!
The average cost of a designer jacket decreased by $3.765 each year
between 2000 and 2015.
The average cost of a designer jacket increased by $3.765 each year
between 2000 and 2015.
The average cost of a designer jacket decreased by $4815 each year
between 2000 and 2015.
The average cost of a designer jacket increased by $4815 each year
between 2000 and 2015.
Answer Explanation
Correct answer:
The average cost of a designer jacket increased by $3.765 each year
between 2000 and 2015.
Since the slope of the line is positive 3.765, the average increase in cost
is $3.765 per year.
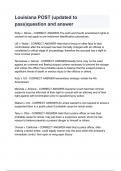
Question
The scatter plot below shows data for the average cost of a high-end computer ( y,
in dollars) in the year x years since 2000. The least squares regression line is
given by yˆ=−1677+314x.