MATH P2 NOTES 2024
Asia Yarlett
Asia
,
, STATISTICS
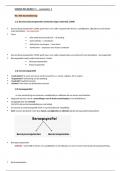
MEASURES OF CENTRAL TENDANCY BOX AND WHISKER (5 No Summary)
(i) average ↓ (n + 1) -
=(n position in ordered set
Mean :
+ 1)
3(n +1) >
-
Lif decimal
min Q1 Q2 Q3
=
max : .
ave .
of 2
data 25% between
· i Kisum values in sela
25 % 25 %
25 %
intergers its
what is in
sum elements in set
median median position 0 25
median ,
of lower of upper or 0 ,
11
half half ere ?
Estimated midpt interval free
S
·
x
=
-
Mean
(intervals) total cumul .
freg
MEASURES OF DISPERSION
Median :
(Q2) middle value in ordered set Range = largest value -
smallest
Q2 (position) = no elements in set IQR =
Q3 -
Q,
Semi- = Q ,
Position =
h (cumul f) . + 1 IQR 2
Median 2
Percentile : divides into 100
position = percentilexn
Mode :
most common 100
modal class = Interval w/ highest f
: (Ki-) now much variation CALCULATOR
I
STANDARD DEVIATION
dispersion there Is mode - stat
M
around ment >
- 01-var >
- AS
-
low-: : Ba Consistents
-
high- .:: Spread out (inconsistent)
>
- shift e
value given >
- Q Var I n no data entries
:
&
.
VARIANCE (Ki . I
2 mean
. SK
3 sta der
M
(4 S4) .
-
-
within one standard dev below mean :
i-o = around up)
-
one standard dev .
above mean i + o =
(round down)
-
xxn = Ex
d
↓ ↓
mean no values Sum of values in set
* ① or
O same value from each paint
>
-
doest affect o
>
-
changes mean by that value
, .
OGIVE midpt o POINTS TO PLOT : - Y
↑
interval
*
o
Intervals freq . cumulat Freq MXf ground :; O
< 10 I I
1j
10 ; ~
11 < < 20 2
(2 3
20 ; 3
21 < &(30 S G
30 s
;
SUMMETRICAL 3 SKEWED DATA O
intervals (values
↳ look & Median Q2
⑭main
SUMMETRICAL DATA
(NORMALLY DISTRIB ) .
Mi
right
tail
RIGHT SKEW ·
I l longer
2 POSITIVELY SKEWED)
mean median
SKEWED)
LEFT SREW left
tail longer
(NEGATIVELY / II
mean median
QUARTILES
:
100-
9 =
(n + 1) =
25 %
=
25th percentile
Q : (n+ 1) =
50 % =
50th percentile calposition avalue
93 =
* (n + 1) = 75 %= 75th
percentile
IPR =
P3(e) -
Q , Laue)
=
IPR value
OUTLIERS
·
value < P ,
-
(1 5 x [QR)
,
·
value < 03 + (1 , 5x [QR)
, SCATTER PLOTS
plot of bivariate data which shows relationship between the two (kb 4)
REGRESSION LINES (BEST FIT)
shows general trend (never join dots)
-
y
Interpolation : Extrapolation :
Predict
within
value
doman
Y
-- predict
outside doman
value
↳ range of set R
↳ range of set R
*
Reg .
line CAN predict
-
not always linear
it %
CALCULATOR :
Mode
- -
↳ stat
Quadratic Exponential Inverse 2 : A + BX
(input into table
LEAST SQUARES REGRESSION LINE
y = mr + C
throughthe outliers
generate ic i
5:Re:Bir
= c + mR
(u
-
y
=
A + BR ; y)
↑
ur gradient
input values in calc to find A Y B- To determine
stat
mean :
shift Et
CORRELATION COEFFICIENT -11 4 Var
(x}y)
:
strength of linear relationship between 2 variables Choose is ;
i .)
ete
↳ how well (cluse) data "Sits the line of best hr
(the closer to zero ,
the weaker)
the least sq line
>
- how accurate is
reg .
.... ....
....... ii : :i .
ii ii .........
r = -
1 ro r =
0 > o V= 1
5 5 I
T
0 O 0
,
,
-
I I I I
(none)
< perfect) < perfect
? weak > stron
strong negative positive
9
, ANALYTICAL GEOMETRY
AVE . GRADIENT LINES
Yb- Ya
MAB straight y mc + C
-
= : =
Ub Ka
horizontal k
-
:
y (constant)
-
=
DISTANCE FORMULA
-
vertical : x = k
AB =
(yb ya)2 +
-
(xb -
(a)
-
perpendicular + : m. x mc
=
-1 /m .
= -
m
"
tip and change"
MIDPOINT Parallel 11 :
m, me
-
=
M(Ka yay
+ 4b
;
-
Collinear :
MAB =
MBC
ANGLE Of INCLINATION O ------ ,
object
tand
ma
=
of ANGLE OF ELEVATION
m
tangent
&
=
of inclin
↳betweenhorion a
↳ .
,
- ↓ of depression < of elevation
a
=
--ETongle MCOO
: + 180
·
Calts ; Il lines
m > ② obtuse
ANGLE OF DEPRESSION
O acute
↓ between horizonal ,
down to an object
-
measured anti-clockwise
of inclination: + 180"
=>
negative ---- 1. - -
f - - - - -
(as calculator gives the negative object
clock wise angle
PROPERTIES OF QUADRILATERALS
square
para *
Rhombus kite
t
Rectangle
-
diagonals (diagonals)
b ht A b n Area
= b.
Area =
A
Area
19 19
=
= .
.
=
2 2
opp sides parallel 90· diagonals bised angles equal sides equal in
length
, CIRCLES (ANALYTICAL)
when centred at
origin (0; 0)
:
(u -
a) +
(y -
b) = ra n +
yz
= r2
↓ ↓
"radias
n-courd
circle centre cord
INTERSECTIONS Shortest distance between 2 circles ("clearence") =
d - r , re
-
↑
· · 2
.
-
d d
d r, + 12 d = r, + 12 d =
2 -
r, & > r1 + Va
:
Intersect twice :
Intersect once .. Inside & touch : don't intersect
TANGENTS
FINDING EP .
(p O C GIVEN
r tangent
. .
.
1 . Gradient of radius & PO C
.. .
& 2
. Gradient of
=
-1
tangent Mradius YMrangent
po C . .
(kiy)
Y Cradius
mx + 1
tangent)
=
.
3 C
COMPLETING THE SQUARE NOTES
-
to express eg. In form a (r[p)
2
+
q
·
reflect about line
you :
1. More constant to RIS Is in a semi
·
2
. Divide by coefficient of a it it I
3
. + (efficient u)2 both sides
·
All courds on line
y
:
se corresp
?
eg ( - 2
.
; -
2)
4. factorise
x2
yz 2x
hy 11 0
=
+ + + -
x2 + 2x +
y +
my
=
11
x
(2) y by (- ) () 2)2
(x + + =
11 +
SskiPSU, ,
+ + + +
(2 +
(y + 2) =
16
, TRIG .
FUNCTIONS
horizontal shift
(vertical stretch -
Vertical shift
or compress u -( + p) =
x -
p right
30 x ( p) u+ p left
=
+
qp
- -
amplitude
period ↑ qt
(p) q
-
*
= Sim
y (360)
= cos(CEP) Eq
y (360)
Y 1180
MOTHER GRAPHS :
Ya
· 360
uER
u ER
DOMAIN : 1 90 180k
·
u E 1 ,
n= +
(where kell
RANGE :
yE(-1il]
y(( 1 ; 1]
-
yER
--
yf) pic)
-
·
SKETCHING FROM CALCULATOR :
mode e ATable ef(u) = Since +
g(a) =
Cos (2)
-start : 2-180
;
>
- end : ·
180]
* ->
Step =
NERO
, EFFECTS OFa (CHANGE IN AMPLITUDE
stretches or compresses graph vertically &
·
note : when a is negative , indicates graph will be reflected about the ce-axis
↑ Camplitude # O negative
-wherey-valveofsee
a
a
3-
y 2 tance
=
·
100 y / CoSU
=
3 since
-
y = -
-
3-
ab Go
-
3 sink
3-
y
=
-
180
,
-
3-
EFFECTS OF & (VERTICAL SHIFTS)
add +
q : 4 shift up
·
subtr -g .
: I shift down
the standard tan graph
tance 1
tip think of y = new x-axis y = +
:
q as
- (Where g :
0) has a
Fi
2- y-value of 1 at 45"
do 190 10
---------------
y =
t - -
2 y= 2
in
-
--------------
as ist
-
-
3-
-1-
y Since
= + 1 y =
COSC -
2
EFFECTS OF D (CHANGE PERIOD
IN
stretches "In
or compresses graph horizontally
·
fraction
original period
·
OLD < 1 graph isstretched/period increases new period=
-D
·
D < I graph is compressed/period decreases
/
"No of period"
wavelengths in 00
When there's
↳ a period change , angle is multiplied by b
y SinIbu) y cos(bu) y tanbr)
= = =
mother
NB : period of tan
graph
iS 180
note : starting point doesn't change
- too
asymptotes change
&
2 -
2
· ·
-↑
S
I
-i
&
in
·
180 ; -1 360; -1
-
2-
2
-
"Period
-
is 180
(2) COS([x)
y
tano
=
Sin Instead of 360
or
y
=
y =
3%
-
180
2 wave lengths
completed 360 in
(rather than 1)"
, EFFECTS OF P CHORIZONTAL SHIFT
added to the angle
standard form :
y =
sin(u-p)
: sin(c + p) =
sin(U-( =
p)) .. left
: Sin(c-p) =
Sin(K-(#)) :
right
y tan (R + 43)
y Sin(2 + 30) y (os(u 90)
=
= =
=
(k -1 30)) =
< left (l-(#90)) < right (0-1-45)) <left
- -
* cosO shifted 90' right
=
SinO
·
GRAPH INTERPRETATION
·
a-value o negative
↓ When a is
negative E , graph has reflected about l-axis
·
what is the period (120 ; 180 ; 360) what is the b value (3 % 2 % 1)
·
length of line AB : Stop-ybottom or
gleft-right
·
coordinates a sub in r-value to get y-value
form
·
TRASLATIONS & REFLECTIONS :
get into sid .
before interperating
·
flu) = g(x) > where f lies above or on
g
·
E 20 > where is one graph positive & one is negative & o
f ! =0
· g(u) =0 and c values where this graph equals O
bot ove
Mearethepothpotive
or
(P .
O I
.
.
S)
Sin21 COS's tank
An W F
Asia Yarlett
Asia
,
, STATISTICS
MEASURES OF CENTRAL TENDANCY BOX AND WHISKER (5 No Summary)
(i) average ↓ (n + 1) -
=(n position in ordered set
Mean :
+ 1)
3(n +1) >
-
Lif decimal
min Q1 Q2 Q3
=
max : .
ave .
of 2
data 25% between
· i Kisum values in sela
25 % 25 %
25 %
intergers its
what is in
sum elements in set
median median position 0 25
median ,
of lower of upper or 0 ,
11
half half ere ?
Estimated midpt interval free
S
·
x
=
-
Mean
(intervals) total cumul .
freg
MEASURES OF DISPERSION
Median :
(Q2) middle value in ordered set Range = largest value -
smallest
Q2 (position) = no elements in set IQR =
Q3 -
Q,
Semi- = Q ,
Position =
h (cumul f) . + 1 IQR 2
Median 2
Percentile : divides into 100
position = percentilexn
Mode :
most common 100
modal class = Interval w/ highest f
: (Ki-) now much variation CALCULATOR
I
STANDARD DEVIATION
dispersion there Is mode - stat
M
around ment >
- 01-var >
- AS
-
low-: : Ba Consistents
-
high- .:: Spread out (inconsistent)
>
- shift e
value given >
- Q Var I n no data entries
:
&
.
VARIANCE (Ki . I
2 mean
. SK
3 sta der
M
(4 S4) .
-
-
within one standard dev below mean :
i-o = around up)
-
one standard dev .
above mean i + o =
(round down)
-
xxn = Ex
d
↓ ↓
mean no values Sum of values in set
* ① or
O same value from each paint
>
-
doest affect o
>
-
changes mean by that value
, .
OGIVE midpt o POINTS TO PLOT : - Y
↑
interval
*
o
Intervals freq . cumulat Freq MXf ground :; O
< 10 I I
1j
10 ; ~
11 < < 20 2
(2 3
20 ; 3
21 < &(30 S G
30 s
;
SUMMETRICAL 3 SKEWED DATA O
intervals (values
↳ look & Median Q2
⑭main
SUMMETRICAL DATA
(NORMALLY DISTRIB ) .
Mi
right
tail
RIGHT SKEW ·
I l longer
2 POSITIVELY SKEWED)
mean median
SKEWED)
LEFT SREW left
tail longer
(NEGATIVELY / II
mean median
QUARTILES
:
100-
9 =
(n + 1) =
25 %
=
25th percentile
Q : (n+ 1) =
50 % =
50th percentile calposition avalue
93 =
* (n + 1) = 75 %= 75th
percentile
IPR =
P3(e) -
Q , Laue)
=
IPR value
OUTLIERS
·
value < P ,
-
(1 5 x [QR)
,
·
value < 03 + (1 , 5x [QR)
, SCATTER PLOTS
plot of bivariate data which shows relationship between the two (kb 4)
REGRESSION LINES (BEST FIT)
shows general trend (never join dots)
-
y
Interpolation : Extrapolation :
Predict
within
value
doman
Y
-- predict
outside doman
value
↳ range of set R
↳ range of set R
*
Reg .
line CAN predict
-
not always linear
it %
CALCULATOR :
Mode
- -
↳ stat
Quadratic Exponential Inverse 2 : A + BX
(input into table
LEAST SQUARES REGRESSION LINE
y = mr + C
throughthe outliers
generate ic i
5:Re:Bir
= c + mR
(u
-
y
=
A + BR ; y)
↑
ur gradient
input values in calc to find A Y B- To determine
stat
mean :
shift Et
CORRELATION COEFFICIENT -11 4 Var
(x}y)
:
strength of linear relationship between 2 variables Choose is ;
i .)
ete
↳ how well (cluse) data "Sits the line of best hr
(the closer to zero ,
the weaker)
the least sq line
>
- how accurate is
reg .
.... ....
....... ii : :i .
ii ii .........
r = -
1 ro r =
0 > o V= 1
5 5 I
T
0 O 0
,
,
-
I I I I
(none)
< perfect) < perfect
? weak > stron
strong negative positive
9
, ANALYTICAL GEOMETRY
AVE . GRADIENT LINES
Yb- Ya
MAB straight y mc + C
-
= : =
Ub Ka
horizontal k
-
:
y (constant)
-
=
DISTANCE FORMULA
-
vertical : x = k
AB =
(yb ya)2 +
-
(xb -
(a)
-
perpendicular + : m. x mc
=
-1 /m .
= -
m
"
tip and change"
MIDPOINT Parallel 11 :
m, me
-
=
M(Ka yay
+ 4b
;
-
Collinear :
MAB =
MBC
ANGLE Of INCLINATION O ------ ,
object
tand
ma
=
of ANGLE OF ELEVATION
m
tangent
&
=
of inclin
↳betweenhorion a
↳ .
,
- ↓ of depression < of elevation
a
=
--ETongle MCOO
: + 180
·
Calts ; Il lines
m > ② obtuse
ANGLE OF DEPRESSION
O acute
↓ between horizonal ,
down to an object
-
measured anti-clockwise
of inclination: + 180"
=>
negative ---- 1. - -
f - - - - -
(as calculator gives the negative object
clock wise angle
PROPERTIES OF QUADRILATERALS
square
para *
Rhombus kite
t
Rectangle
-
diagonals (diagonals)
b ht A b n Area
= b.
Area =
A
Area
19 19
=
= .
.
=
2 2
opp sides parallel 90· diagonals bised angles equal sides equal in
length
, CIRCLES (ANALYTICAL)
when centred at
origin (0; 0)
:
(u -
a) +
(y -
b) = ra n +
yz
= r2
↓ ↓
"radias
n-courd
circle centre cord
INTERSECTIONS Shortest distance between 2 circles ("clearence") =
d - r , re
-
↑
· · 2
.
-
d d
d r, + 12 d = r, + 12 d =
2 -
r, & > r1 + Va
:
Intersect twice :
Intersect once .. Inside & touch : don't intersect
TANGENTS
FINDING EP .
(p O C GIVEN
r tangent
. .
.
1 . Gradient of radius & PO C
.. .
& 2
. Gradient of
=
-1
tangent Mradius YMrangent
po C . .
(kiy)
Y Cradius
mx + 1
tangent)
=
.
3 C
COMPLETING THE SQUARE NOTES
-
to express eg. In form a (r[p)
2
+
q
·
reflect about line
you :
1. More constant to RIS Is in a semi
·
2
. Divide by coefficient of a it it I
3
. + (efficient u)2 both sides
·
All courds on line
y
:
se corresp
?
eg ( - 2
.
; -
2)
4. factorise
x2
yz 2x
hy 11 0
=
+ + + -
x2 + 2x +
y +
my
=
11
x
(2) y by (- ) () 2)2
(x + + =
11 +
SskiPSU, ,
+ + + +
(2 +
(y + 2) =
16
, TRIG .
FUNCTIONS
horizontal shift
(vertical stretch -
Vertical shift
or compress u -( + p) =
x -
p right
30 x ( p) u+ p left
=
+
qp
- -
amplitude
period ↑ qt
(p) q
-
*
= Sim
y (360)
= cos(CEP) Eq
y (360)
Y 1180
MOTHER GRAPHS :
Ya
· 360
uER
u ER
DOMAIN : 1 90 180k
·
u E 1 ,
n= +
(where kell
RANGE :
yE(-1il]
y(( 1 ; 1]
-
yER
--
yf) pic)
-
·
SKETCHING FROM CALCULATOR :
mode e ATable ef(u) = Since +
g(a) =
Cos (2)
-start : 2-180
;
>
- end : ·
180]
* ->
Step =
NERO
, EFFECTS OFa (CHANGE IN AMPLITUDE
stretches or compresses graph vertically &
·
note : when a is negative , indicates graph will be reflected about the ce-axis
↑ Camplitude # O negative
-wherey-valveofsee
a
a
3-
y 2 tance
=
·
100 y / CoSU
=
3 since
-
y = -
-
3-
ab Go
-
3 sink
3-
y
=
-
180
,
-
3-
EFFECTS OF & (VERTICAL SHIFTS)
add +
q : 4 shift up
·
subtr -g .
: I shift down
the standard tan graph
tance 1
tip think of y = new x-axis y = +
:
q as
- (Where g :
0) has a
Fi
2- y-value of 1 at 45"
do 190 10
---------------
y =
t - -
2 y= 2
in
-
--------------
as ist
-
-
3-
-1-
y Since
= + 1 y =
COSC -
2
EFFECTS OF D (CHANGE PERIOD
IN
stretches "In
or compresses graph horizontally
·
fraction
original period
·
OLD < 1 graph isstretched/period increases new period=
-D
·
D < I graph is compressed/period decreases
/
"No of period"
wavelengths in 00
When there's
↳ a period change , angle is multiplied by b
y SinIbu) y cos(bu) y tanbr)
= = =
mother
NB : period of tan
graph
iS 180
note : starting point doesn't change
- too
asymptotes change
&
2 -
2
· ·
-↑
S
I
-i
&
in
·
180 ; -1 360; -1
-
2-
2
-
"Period
-
is 180
(2) COS([x)
y
tano
=
Sin Instead of 360
or
y
=
y =
3%
-
180
2 wave lengths
completed 360 in
(rather than 1)"
, EFFECTS OF P CHORIZONTAL SHIFT
added to the angle
standard form :
y =
sin(u-p)
: sin(c + p) =
sin(U-( =
p)) .. left
: Sin(c-p) =
Sin(K-(#)) :
right
y tan (R + 43)
y Sin(2 + 30) y (os(u 90)
=
= =
=
(k -1 30)) =
< left (l-(#90)) < right (0-1-45)) <left
- -
* cosO shifted 90' right
=
SinO
·
GRAPH INTERPRETATION
·
a-value o negative
↓ When a is
negative E , graph has reflected about l-axis
·
what is the period (120 ; 180 ; 360) what is the b value (3 % 2 % 1)
·
length of line AB : Stop-ybottom or
gleft-right
·
coordinates a sub in r-value to get y-value
form
·
TRASLATIONS & REFLECTIONS :
get into sid .
before interperating
·
flu) = g(x) > where f lies above or on
g
·
E 20 > where is one graph positive & one is negative & o
f ! =0
· g(u) =0 and c values where this graph equals O
bot ove
Mearethepothpotive
or
(P .
O I
.
.
S)
Sin21 COS's tank
An W F