

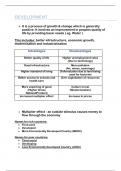
DEVELOPMENT
Ø It is a process of growth & change which is generally
positive. It involves an improvement in peoples quality of
life by providing basic needs ( eg. Water )
This includes: better infrastructure, economic growth,
modernisation and Industrialisation
Advantages Disadvantages
Better quality of life Higher unemployment rates
(Due to technology)
Good infrastructure More pollution
(Air, mines, sewerage)
Higher standard of living Deforestation due to land being
used for factories
Better access to schools and Over exploitation of resources
health care
More exporting of good Culture Is lost
(Higher Gross (Westernisation)
NationalProduct)
Increased multiplier effect Increase In prices
Ø Multiplier effect - an outside stimulus causes money to
flow through the economy
Names for rich countries:
• First word
• Developed
• More Economically Developed Country (MEDC)
Names for poor countries:
• Third world
• Developing
• Less Economically Developed Country (LEDC)
, LEDC MEDC
Diet Malnutrition, starch Balanced diet, obesity -fast
food
Jobs Farming, primary Secondary or tertiary
Infant mortality Die before they are 1 Not usual
Pop. Growth Rapid Slow- small families
Exports Raw materials Manufactured good - value
added
People per doctor About 3000 About 500
LE Often under 45; HIV/AIDS Usually over 70
Housing Poor quality High standard of living,
electricity,running
water,sewerage
Energy Low level of energy High levels of consumption
consumption
Education Children do not often finish High literacy levels, 12 yrs of
secondary school schooling
THE BRANDT LINE
Ø An imaginary line dividing the world into the rich north and the
poor south.
Ø The line is curvy due to the exceptions, eg) Australia is in the
south but Is a MEDC.
Ø Northern hemisphere are the MEDC, eg) France
Ø Southern hemisphere are the LEDC, eg) Mozambique
SOUTH AFRICA
Ø Is an emerging country
Ø Many parts of SA are typical of a MEDC (hemingways) but others
are more like an LEDC (townships)
Photo analysis: is NOT and accurate way of determining if a country is
developed or developing. It is just a snapshot of one place
Pie charts :
% x 3.6 = total degrees
• Use a colour key
• Show working out
Ø It is a process of growth & change which is generally
positive. It involves an improvement in peoples quality of
life by providing basic needs ( eg. Water )
This includes: better infrastructure, economic growth,
modernisation and Industrialisation
Advantages Disadvantages
Better quality of life Higher unemployment rates
(Due to technology)
Good infrastructure More pollution
(Air, mines, sewerage)
Higher standard of living Deforestation due to land being
used for factories
Better access to schools and Over exploitation of resources
health care
More exporting of good Culture Is lost
(Higher Gross (Westernisation)
NationalProduct)
Increased multiplier effect Increase In prices
Ø Multiplier effect - an outside stimulus causes money to
flow through the economy
Names for rich countries:
• First word
• Developed
• More Economically Developed Country (MEDC)
Names for poor countries:
• Third world
• Developing
• Less Economically Developed Country (LEDC)
, LEDC MEDC
Diet Malnutrition, starch Balanced diet, obesity -fast
food
Jobs Farming, primary Secondary or tertiary
Infant mortality Die before they are 1 Not usual
Pop. Growth Rapid Slow- small families
Exports Raw materials Manufactured good - value
added
People per doctor About 3000 About 500
LE Often under 45; HIV/AIDS Usually over 70
Housing Poor quality High standard of living,
electricity,running
water,sewerage
Energy Low level of energy High levels of consumption
consumption
Education Children do not often finish High literacy levels, 12 yrs of
secondary school schooling
THE BRANDT LINE
Ø An imaginary line dividing the world into the rich north and the
poor south.
Ø The line is curvy due to the exceptions, eg) Australia is in the
south but Is a MEDC.
Ø Northern hemisphere are the MEDC, eg) France
Ø Southern hemisphere are the LEDC, eg) Mozambique
SOUTH AFRICA
Ø Is an emerging country
Ø Many parts of SA are typical of a MEDC (hemingways) but others
are more like an LEDC (townships)
Photo analysis: is NOT and accurate way of determining if a country is
developed or developing. It is just a snapshot of one place
Pie charts :
% x 3.6 = total degrees
• Use a colour key
• Show working out


