Luthando Zulu: 17599770
Finance 2B – FINM6212
LU3: Cost-volume-profit Analysis
Introduction:
CVP analyses the effect on profits and costs to changes in:
Variable costs
Fixed costs
Selling prices
Volume
Product mix
It enables management to plan and cope with planning decisions.
What are the underlying assumptions?
The underlying assumptions of CVP include:
Costs and revenues exhibit a linear behavior throughout a given activity range
Costs can be accurately classified as either fixed or variable
Costs are affected by changes in the level of activity only
There is a short-term planning period
All units produced are sold
When a company sells more than one product type, the sales mix remains constant.
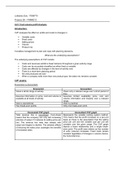
CVP graphs:
Economist vs Accountant:
Economist Accountant
Views a whole range of activity. Views only a relevant range over a short period of
time.
Assumes information on price, cost and volume is Assumes limited availability price, cost and
available at all levels of activity. volume information and linearity over a relevant
range.
View is expositional. View is practical.
Two break-even points. Only one break-even point.
Economist CVP graph Accountant CVP graph
Total revenue line is curvi-linear. Curvi-linear Represents the variable costing system method.
means that the company can only sell increasing This means that the profit increases on a per-unit
volumes of output if it reduces its selling price per basis as there is the assumption that the selling
unit. The revenue line rises less steeply with price per unit and the variable cost per unit are
output and begins to decline. The adverse effects constant over the given range. The CVP graph
of reducing the sales price outweighs the benefits depicts a linear relationship and a single break-
even point. The profit area widens as the number
of increased sales.
of units (volume) increases. Fixed costs remain
constant regardless of changes in volume (hence,
the horizontal line).
1
Finance 2B – FINM6212
LU3: Cost-volume-profit Analysis
Introduction:
CVP analyses the effect on profits and costs to changes in:
Variable costs
Fixed costs
Selling prices
Volume
Product mix
It enables management to plan and cope with planning decisions.
What are the underlying assumptions?
The underlying assumptions of CVP include:
Costs and revenues exhibit a linear behavior throughout a given activity range
Costs can be accurately classified as either fixed or variable
Costs are affected by changes in the level of activity only
There is a short-term planning period
All units produced are sold
When a company sells more than one product type, the sales mix remains constant.
CVP graphs:
Economist vs Accountant:
Economist Accountant
Views a whole range of activity. Views only a relevant range over a short period of
time.
Assumes information on price, cost and volume is Assumes limited availability price, cost and
available at all levels of activity. volume information and linearity over a relevant
range.
View is expositional. View is practical.
Two break-even points. Only one break-even point.
Economist CVP graph Accountant CVP graph
Total revenue line is curvi-linear. Curvi-linear Represents the variable costing system method.
means that the company can only sell increasing This means that the profit increases on a per-unit
volumes of output if it reduces its selling price per basis as there is the assumption that the selling
unit. The revenue line rises less steeply with price per unit and the variable cost per unit are
output and begins to decline. The adverse effects constant over the given range. The CVP graph
of reducing the sales price outweighs the benefits depicts a linear relationship and a single break-
even point. The profit area widens as the number
of increased sales.
of units (volume) increases. Fixed costs remain
constant regardless of changes in volume (hence,
the horizontal line).
1


