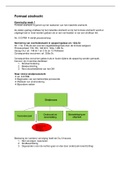
2.1.1 economic growth
short run economic growth = increase in real GDP
long run economic growth = increase in productive potential (outward shift of PPF)
✅ consumer living standards improve = ❌growth = depletion of natural resources =
disposable income increases = real income lack of sustainability
increases
✅ increased business confidence =
increased investment (bull market) =
❌ greater inequality -> companies may not
invest but distribute profit to shareholders
improved quality of goods & new innovation
✅increased employment opportunities ❌ UKs high marginal propensity to import =
deteriorating BofP in long run
✅ export-led growth = movement away
from budget deficit = improved current
❌demand-pull inflation
account on BofP
✅ increased tax revenue for govt, =
provision of public goods = redistribute
❌ short & long run effects -> technological
advancements
incomes
Infrastructure = large physical capital projects provided by the government (e,g roads,
railways eg HS2, Victoria Bridge)
GNI = GDP + net overseas + dividends + interest payments
GDP = total output of the economy
GDP per capita = national income per person
- real = adjusted for inflation / nominal = not adjusted for inflation
- value of goods and services = what they are worth / volume = number produced
values may differ from country due to:l
Rising UK population relative to Germany’s
- Falling productivity in country
- Lack of exports in country
- Increased imports (due to increased domestic consumption)
- Change in relative cost of living
- Differing inflation rates
- Method of calculating PPP (e,g items in basket of goods)
PPP: estimates how much exchange rate of an economy needs to be adjusted by so
exchange between countries is equivalent
- improves accuracy when comparing data between couturiers
- compares cost of living between different countries
- calculated by comparing price of basket of goods in different countries
Index number (y/base number X 100) = an economic data figure that reflects price/quantity
compared with base year
, Recession
negative economic growth for two consecutive quarters
1. falling inflation due to reduction in consumer expenditure
2. rising unemployment due to less demand for workers caused by falling real output
3. falling firm investments leading to high level of business failures
4. increased budget deficit due to a rise in government spending on benefits
5. worsening of fiscal position due to a fall in tax revenues
Limitations of using GDP Data to determine standards of living
1. Differences in distribution of income
2. Differences in quality of life (education and healthcare)
3. Hidden economy doesn’t reflect true living standards
4. Exchange rates may not accurately reflect differences in PPP of currencies
5. Population growth may account for major growth in GDP of developing countries
6. Reliability of data & methods of calculation
7. Spending on investment raises future standard of living in expense of current living
standards
eval
● ease of using GDP data for comparison over time
● standard measure & well understood (internationally recognised)
● other methods (gdp per capita)
● standard of living = subjective = cannot be measure effectively and accurately
● doesn’t not include other determinants (healthcare, education)
Effect of change in real incomes & subjective happiness
1. Decreased real income = decreased welfare and standard of living
2. Worry about state of personal finances (disposable income/taxes/childcare)
3. Consumers worry/anxious about ability to pay mortgages & repay debts
eval.
● leisure time, environment, family/friends
● increased borrowing occurs to make up for falling real incomes