Statistics
Discrete data = information found by counting
Continuous data = information collected by measurement
Organising data
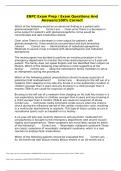
1. Stem and leaf diagram
e.g. 164 154 159 172 171 161 164 145 147 162 157 163 162 166 171
Stem Leaves
14 4; 7
15 4; 7; 9
16 1; 2; 2; 3; 4; 4; 6
17 1; 1; 2
Common digits Varying digit
2. Grouping data
Put into classes or intervals.
e.g. 60 97 71 83 62 76 76 80 84 71 89 82 75 81 76 80 79 82 74 67
60 – 64 2
65 – 69 1
70 – 74 3
75 – 79 4
80 – 84 7
85 – 89 2
90 – 94 0
95 – 99 1
, Analysing data
- measures of central tendency
- measures of dispersion
Measures of central tendency
𝑠𝑢𝑚 𝑜𝑓 𝑎𝑙𝑙 𝑣𝑎𝑙𝑢𝑒𝑠 𝛴𝑥
Mean (average) x̅ = 𝑡𝑜𝑡𝑎𝑙 𝑛𝑢𝑚𝑏𝑒𝑟 𝑜𝑓 𝑣𝑎𝑙𝑢𝑒𝑠 = 𝑛
Mode = value that occurs the most often
(𝑛+1)
Median (middle value) = 2
= position of value
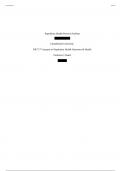
Central tendency from a frequency table
𝛴𝑓𝑥
Mean = 𝑛
Mode = choose value with highest frequency
Median = add up the frequencies / 2
(this will give you the frequency values, if odd that the median lies between, or if even that the
median lies on)
e.g.
Value 3 4 5 6
Frequency 1 4 3 2
(1 𝑥 3)+(4 𝑥 4)+(3 𝑥 5)+(2 𝑥 6)
Mean = 10
= 4.6
Mode = 4
Median = 4
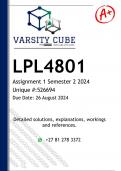
Central tendency from a stem and leaf diagram
(write data values out and do as normal)
𝛴𝑥
Mean = 𝑛
Mode = value that occurs the most often
(𝑛+1)
Median = = position of value
2
e.g.
Stem Leaf
2 6; 8
3 2; 3
4 0; 5; 6; 6
5 4; 4; 7
6 0; 5; 8; 9
Discrete data = information found by counting
Continuous data = information collected by measurement
Organising data
1. Stem and leaf diagram
e.g. 164 154 159 172 171 161 164 145 147 162 157 163 162 166 171
Stem Leaves
14 4; 7
15 4; 7; 9
16 1; 2; 2; 3; 4; 4; 6
17 1; 1; 2
Common digits Varying digit
2. Grouping data
Put into classes or intervals.
e.g. 60 97 71 83 62 76 76 80 84 71 89 82 75 81 76 80 79 82 74 67
60 – 64 2
65 – 69 1
70 – 74 3
75 – 79 4
80 – 84 7
85 – 89 2
90 – 94 0
95 – 99 1
, Analysing data
- measures of central tendency
- measures of dispersion
Measures of central tendency
𝑠𝑢𝑚 𝑜𝑓 𝑎𝑙𝑙 𝑣𝑎𝑙𝑢𝑒𝑠 𝛴𝑥
Mean (average) x̅ = 𝑡𝑜𝑡𝑎𝑙 𝑛𝑢𝑚𝑏𝑒𝑟 𝑜𝑓 𝑣𝑎𝑙𝑢𝑒𝑠 = 𝑛
Mode = value that occurs the most often
(𝑛+1)
Median (middle value) = 2
= position of value
Central tendency from a frequency table
𝛴𝑓𝑥
Mean = 𝑛
Mode = choose value with highest frequency
Median = add up the frequencies / 2
(this will give you the frequency values, if odd that the median lies between, or if even that the
median lies on)
e.g.
Value 3 4 5 6
Frequency 1 4 3 2
(1 𝑥 3)+(4 𝑥 4)+(3 𝑥 5)+(2 𝑥 6)
Mean = 10
= 4.6
Mode = 4
Median = 4
Central tendency from a stem and leaf diagram
(write data values out and do as normal)
𝛴𝑥
Mean = 𝑛
Mode = value that occurs the most often
(𝑛+1)
Median = = position of value
2
e.g.
Stem Leaf
2 6; 8
3 2; 3
4 0; 5; 6; 6
5 4; 4; 7
6 0; 5; 8; 9