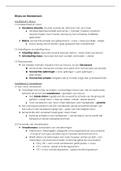
Financial Analysis - Ratios (Lecture 3)
Financial Statement Analysis – Key Ratios
1. Why Ratios?
→ Raw numbers mean little → Ratios give context
→ Show relationships, trends & comparisons
2. Main Ratio Categories
A. Profitability Ratios (How good at making profit?)
1. Gross Profit Margin
= Gross Profit / Sales Revenue × 100
→ What % left after direct costs
2. Operating Profit Margin
= Op Profit / Sales × 100
→ Core business profitability
3. Net Profit Margin
= Net Profit / Sales × 100
→ Final take-home % (very industry-specific)
4. Return on Assets (ROA)
= Net Profit / Total Assets × 100
→ How efficiently assets make profit
↓ Declining margins/ROA = Red flag!
B. Efficiency (Asset Management) Ratios
1. Total Asset Turnover
= Sales Revenue / Total Assets
→ Higher = better use of assets
2. Inventory Turnover (days)
= Inventory × 365 / COGS
→ Lower = faster selling stock
3. Receivables Collection (days)
= Trade Receivables × 365 / Sales
→ Fewer days = faster cash in
4. Payables Payment (days)