SPSS Sessies
Sessie 2
Opdracht 1
A. How many cases are listed? Are there any missing values?
In SPSS: Analyze – Frequenties
Er zijn in totaal 95 cases in de dataset. Er zijn geen missende waarden.
B. Which variable(s) are quantitative (continuous), which are qualitative (categorical)?
Geslacht is als enige een categorische variabelen, de overige variabelen zijn allemaal continu.
C. What are the frequencies of the response categories on the qualitative variable(s)? Is any of
these frequencies remarkably low (less than 10% of the sample size)?
In onze dataset zijn 55 mannen en 40 vrouwen. Er zijn geen frequenties opmerkelijk laag.
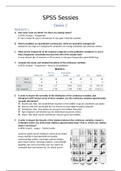
D. Compute the means and standard deviations of the continuous variables.
In SPSS: Analyse – Frequencies – Mean & SD aanklikken
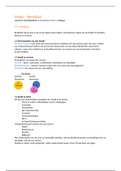
E. In order to inspect the normality of the distribution of the continuous variables, plot
histograms (with normal curve) of these variables. Are the continuous variables approximately
normally distributed?
Routine job: Nee, veel ontbrekende waarden in het midden en grote uitschieters aan zijden
Secrecy: Niet echt, grote piek bij 2 en daarna vrij veel vlakke waarden (skewed)
Satisfaction: Nee, twee pieken en een gat in het midden (bimodal)
Age: Enigsinds, wel skewed naar de rechterkant (staart zit rechts).
Salary: Ook staart aan de rechterkant, ook een gat in het midden.
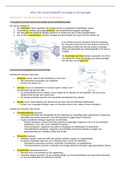
F. In order to inspect the linearity of the relations between the continuous variables, request a
scatterplot matrix. Are all bivariate relations approximately linear? That is, is there any relation
which is non-linear?
In SPSS: Graphs – Legacy – Matrix Scatter
Zowel de relatie tussen leeftijd en salaris als de relatie
tussen leeftijd en tevredenheid kent enkele
merkwaardige outliers (sommige ouderen hebben
geen hoger salaris). Sommige ouderen, waarschijnlijk
dezelfde, zijn niet zo tevreden over hun salaris als
voorspeld door een lineaire lijn. De relatie tussen
, salaris en tevredenheid is kromlijnig. De tevredenheid groeit niet zozeer bij hoge
salarisverhogingen als bij lage salarisverhogingen
G. Compute the correlations between the quantitative variables. (1G) Are there any remarkably
high/low values (i.e., close to 0, -1, or +1)?
Opdracht 2
A. Write out the regression formula. What is the predicted R2 ? Which variable has the largest
unstandardized B-weight?
Satisfaction Salary = 5.44 – (0.33 x routine job) + (0.13 x secrecy salary) + (0.004 x salary)
R2 = .559 = 55.9% verklaarde variantie
Variabele met de grootste niet-gestandaardiseerde b-coëfficiënt = routine job (b = -.328)
B. Which predictors seem relevant? Consider in your answer the standardized regression weights
and their significance
Alleen de predictoren met significante regressie gewichten: dat is alleen salaris
C. You will now get acquainted to the option in the regression window to specify multiple blocks
of predictors. Did the R2 change significantly after removing the predictor you indicated?
In SPSS: Analyze – Regression – Lineair – Zet in blok 1 the variabelen item 1, item 2 en salaris –
klik op Next – zet in blok 2 de variabele item 2 en vervang ‘Enter’ door Remove – zet als laatste
bij Statistics de R square change aan
In de output onder Model Summary is te zien dat de R2 veranderd is van een .559 naar een .558
gegaan en dit is niet significant slechter (sig F change = .572)
D. What do you conclude concerning this variable?
Sessie 2
Opdracht 1
A. How many cases are listed? Are there any missing values?
In SPSS: Analyze – Frequenties
Er zijn in totaal 95 cases in de dataset. Er zijn geen missende waarden.
B. Which variable(s) are quantitative (continuous), which are qualitative (categorical)?
Geslacht is als enige een categorische variabelen, de overige variabelen zijn allemaal continu.
C. What are the frequencies of the response categories on the qualitative variable(s)? Is any of
these frequencies remarkably low (less than 10% of the sample size)?
In onze dataset zijn 55 mannen en 40 vrouwen. Er zijn geen frequenties opmerkelijk laag.
D. Compute the means and standard deviations of the continuous variables.
In SPSS: Analyse – Frequencies – Mean & SD aanklikken
E. In order to inspect the normality of the distribution of the continuous variables, plot
histograms (with normal curve) of these variables. Are the continuous variables approximately
normally distributed?
Routine job: Nee, veel ontbrekende waarden in het midden en grote uitschieters aan zijden
Secrecy: Niet echt, grote piek bij 2 en daarna vrij veel vlakke waarden (skewed)
Satisfaction: Nee, twee pieken en een gat in het midden (bimodal)
Age: Enigsinds, wel skewed naar de rechterkant (staart zit rechts).
Salary: Ook staart aan de rechterkant, ook een gat in het midden.
F. In order to inspect the linearity of the relations between the continuous variables, request a
scatterplot matrix. Are all bivariate relations approximately linear? That is, is there any relation
which is non-linear?
In SPSS: Graphs – Legacy – Matrix Scatter
Zowel de relatie tussen leeftijd en salaris als de relatie
tussen leeftijd en tevredenheid kent enkele
merkwaardige outliers (sommige ouderen hebben
geen hoger salaris). Sommige ouderen, waarschijnlijk
dezelfde, zijn niet zo tevreden over hun salaris als
voorspeld door een lineaire lijn. De relatie tussen
, salaris en tevredenheid is kromlijnig. De tevredenheid groeit niet zozeer bij hoge
salarisverhogingen als bij lage salarisverhogingen
G. Compute the correlations between the quantitative variables. (1G) Are there any remarkably
high/low values (i.e., close to 0, -1, or +1)?
Opdracht 2
A. Write out the regression formula. What is the predicted R2 ? Which variable has the largest
unstandardized B-weight?
Satisfaction Salary = 5.44 – (0.33 x routine job) + (0.13 x secrecy salary) + (0.004 x salary)
R2 = .559 = 55.9% verklaarde variantie
Variabele met de grootste niet-gestandaardiseerde b-coëfficiënt = routine job (b = -.328)
B. Which predictors seem relevant? Consider in your answer the standardized regression weights
and their significance
Alleen de predictoren met significante regressie gewichten: dat is alleen salaris
C. You will now get acquainted to the option in the regression window to specify multiple blocks
of predictors. Did the R2 change significantly after removing the predictor you indicated?
In SPSS: Analyze – Regression – Lineair – Zet in blok 1 the variabelen item 1, item 2 en salaris –
klik op Next – zet in blok 2 de variabele item 2 en vervang ‘Enter’ door Remove – zet als laatste
bij Statistics de R square change aan
In de output onder Model Summary is te zien dat de R2 veranderd is van een .559 naar een .558
gegaan en dit is niet significant slechter (sig F change = .572)
D. What do you conclude concerning this variable?