KEY:
Topic:
Definitions + Calculations + Theory Answers
QW: Question Word And How to do Question (e.g. Evaluate)
Graph Calculations + Explain Trend:
Method for Core Practicals:
Mistakes in Practical Methods + Improve Accuracy:
Exam Practice Additions:
PHYSICS
1. Movement & Position:
v2 = u2 + 2as
F=m*a
When moving, acceleration is not constant: Drag acts on object, drag increases as
velocity increases causing resultant force to decreases.
A heavier plane will have a greater stopping distance so runway may be too short.
Feather vs Hammer:
Feather is lighter than the hammer.
Terminal velocity is reached when drag = weight.
Terminal velocity reached sooner for feather
As less drag force is need to balance weight.
Feather will fall at slower average speed.
Terminal Velocity:
Object has weight due to gravity so it accelerates downwards.
However, as it accelerates, velocity increases so drag increases.
Therefore, resultant force is lower and the acceleration decreases.
Eventually, the drag will increase enough to balance the weight.
At this point, the resultant force = 0 so the acceleration = 0. The object stays at a
constant velocity known as terminal velocity.
Opening a parachute will mean cause object to accelerate upwards, reaches lower
terminal velocity as larger surface area for more drag to act on.
Unbalanced forces causes ball rolling to slow down and stop, F = ma.
There is less drag on the moon because the value of g is lower.
Reduce friction by decreasing mass or making surface smoother.
Different readings for different experiments: Surfaces were not uniformly smooth,
different masses, faulty newton meter.
,Glider Practical:
Stopwatch measure time between two points/time between light gates.
Measure distance between two points/light gates.
Find velocity using: velocity = distance/time
REPEAT READINGS AND FIND AVERAGE
Acceleration = gradient of velocity-time graph.
Cushion of air used on glider: Lifts glider, reduces friction, so glider moves at
constant speed.
Graph shows change in speed/acceleration: Change in gradient.
Area of trapezium = Total distance.
Accuracy Improvements:
Measured average speed, not final speed. (Use light gates)
Reaction time to press stopwatch. (Use light gates) (If circular, complete multiple
laps)
Start car at same starting height
Keep steepness of ramp constant
Mistakes:
Friction is not constant down slope
Car could have hit sides of ramp
Ramps may not have been completely even
Reaction time affected starting of stopwatch
Method – Starting Height:
Hold ruler vertically in between 2 set squares against the base at right angles to
each other. Read from eye level to avoid parallax error.
Stopping distance = Thinking + Braking
Thinking: Age, Alcohol, Drugs, Visibility.
Braking: Condition of brakes, condition of road. More friction = shorter braking
distance.
Stopping distance on graph: Area under graph.
,2. Effects of Forces:
Data that goes up by whole numbers is discrete/non-continuous, use a bar chart.
Data that does not have go up by whole numbers is continuous, use a line graph.
Hooke’s Law: The extension of an elastic object is directly proportional to the force
applied, up to the limit of proportionality.
Work done (Elastic potential energy) = ke2/2
F = ke
Area under graph = elastic potential energy
Gradient = spring constant
Elastic behaviour means a material returns to its original shape when the stretching
force is removed.
Material is not elastic as shown in graph: Does not obey Hooke’s law, not linear,
extension is not directly proportional to force applied.
Improve accuracy of height/length readings: Avoid parallax error by reading at eye level,
use a ruler with smaller intervals so a more precise scale.
Investigating how extension varies with applied force:
Set up spring so it is hanging securely from clamp stand.
Using a ruler, measure initial length of spring when no force is applied.
Add a 100g mass to mass hanger and measure new length of spring.
Calculate extension of spring at by subtracting original value for length with new
length of spring.
Repeat over a range of masses by adding 100g masses one at a time.
Repeat readings and find average by removing masses and finding extension
again.
Plot a graph of forced applied against extension of spring.
Accuracy Improvements:
Read at eye level to avoid parallax error.
Make sure ruler is vertical by holding two set squares against the base at right
angles to each other.
Improve quality of data: Intervals are not same size, test over larger range of values.
NOT repeat readings when asking about quality of data.
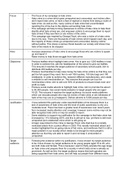
, Straight – Spring
Curved and returns – Rubber band.
Different to stretching of spring: Graph of rubber band is non-linear and
unloading curve does not go through same points as loading
Straight then curves and remains partially extended– Metal Wire
Initially obeys Hooke’s law until elastic limit (linear graph), after which it deforms
plastically and does not return to its originals shape. Unloading curve does not
go through same points as loading, showing permanent deformation.
Curves then stays extended but returns with straight line. – Polyethylene
It shows a non-linear relationship from the start. There is a loop, indicating
significant energy loss during unloading. The material does not obey Hooke’s
Law and exhibits plastic deformation.
Topic:
Definitions + Calculations + Theory Answers
QW: Question Word And How to do Question (e.g. Evaluate)
Graph Calculations + Explain Trend:
Method for Core Practicals:
Mistakes in Practical Methods + Improve Accuracy:
Exam Practice Additions:
PHYSICS
1. Movement & Position:
v2 = u2 + 2as
F=m*a
When moving, acceleration is not constant: Drag acts on object, drag increases as
velocity increases causing resultant force to decreases.
A heavier plane will have a greater stopping distance so runway may be too short.
Feather vs Hammer:
Feather is lighter than the hammer.
Terminal velocity is reached when drag = weight.
Terminal velocity reached sooner for feather
As less drag force is need to balance weight.
Feather will fall at slower average speed.
Terminal Velocity:
Object has weight due to gravity so it accelerates downwards.
However, as it accelerates, velocity increases so drag increases.
Therefore, resultant force is lower and the acceleration decreases.
Eventually, the drag will increase enough to balance the weight.
At this point, the resultant force = 0 so the acceleration = 0. The object stays at a
constant velocity known as terminal velocity.
Opening a parachute will mean cause object to accelerate upwards, reaches lower
terminal velocity as larger surface area for more drag to act on.
Unbalanced forces causes ball rolling to slow down and stop, F = ma.
There is less drag on the moon because the value of g is lower.
Reduce friction by decreasing mass or making surface smoother.
Different readings for different experiments: Surfaces were not uniformly smooth,
different masses, faulty newton meter.
,Glider Practical:
Stopwatch measure time between two points/time between light gates.
Measure distance between two points/light gates.
Find velocity using: velocity = distance/time
REPEAT READINGS AND FIND AVERAGE
Acceleration = gradient of velocity-time graph.
Cushion of air used on glider: Lifts glider, reduces friction, so glider moves at
constant speed.
Graph shows change in speed/acceleration: Change in gradient.
Area of trapezium = Total distance.
Accuracy Improvements:
Measured average speed, not final speed. (Use light gates)
Reaction time to press stopwatch. (Use light gates) (If circular, complete multiple
laps)
Start car at same starting height
Keep steepness of ramp constant
Mistakes:
Friction is not constant down slope
Car could have hit sides of ramp
Ramps may not have been completely even
Reaction time affected starting of stopwatch
Method – Starting Height:
Hold ruler vertically in between 2 set squares against the base at right angles to
each other. Read from eye level to avoid parallax error.
Stopping distance = Thinking + Braking
Thinking: Age, Alcohol, Drugs, Visibility.
Braking: Condition of brakes, condition of road. More friction = shorter braking
distance.
Stopping distance on graph: Area under graph.
,2. Effects of Forces:
Data that goes up by whole numbers is discrete/non-continuous, use a bar chart.
Data that does not have go up by whole numbers is continuous, use a line graph.
Hooke’s Law: The extension of an elastic object is directly proportional to the force
applied, up to the limit of proportionality.
Work done (Elastic potential energy) = ke2/2
F = ke
Area under graph = elastic potential energy
Gradient = spring constant
Elastic behaviour means a material returns to its original shape when the stretching
force is removed.
Material is not elastic as shown in graph: Does not obey Hooke’s law, not linear,
extension is not directly proportional to force applied.
Improve accuracy of height/length readings: Avoid parallax error by reading at eye level,
use a ruler with smaller intervals so a more precise scale.
Investigating how extension varies with applied force:
Set up spring so it is hanging securely from clamp stand.
Using a ruler, measure initial length of spring when no force is applied.
Add a 100g mass to mass hanger and measure new length of spring.
Calculate extension of spring at by subtracting original value for length with new
length of spring.
Repeat over a range of masses by adding 100g masses one at a time.
Repeat readings and find average by removing masses and finding extension
again.
Plot a graph of forced applied against extension of spring.
Accuracy Improvements:
Read at eye level to avoid parallax error.
Make sure ruler is vertical by holding two set squares against the base at right
angles to each other.
Improve quality of data: Intervals are not same size, test over larger range of values.
NOT repeat readings when asking about quality of data.
, Straight – Spring
Curved and returns – Rubber band.
Different to stretching of spring: Graph of rubber band is non-linear and
unloading curve does not go through same points as loading
Straight then curves and remains partially extended– Metal Wire
Initially obeys Hooke’s law until elastic limit (linear graph), after which it deforms
plastically and does not return to its originals shape. Unloading curve does not
go through same points as loading, showing permanent deformation.
Curves then stays extended but returns with straight line. – Polyethylene
It shows a non-linear relationship from the start. There is a loop, indicating
significant energy loss during unloading. The material does not obey Hooke’s
Law and exhibits plastic deformation.