4.7.1 – Adaptations & Interdependence
Ecosystems & Communities
o An ecosystem is the interaction between biotic (living) and abiotic (non-living) components & has different levels of
organisation:
• Individual organisms
• Populations (of individual organisms make up a single species)
• Communities (consisting of populations of different species)
o Habitat – a place where an organism/community of organisms live, including all biotic and abiotic factors of the surrounding
environment.
o Environment – surroundings/conditions in which animals, plants or microbes live.
o Population – all the organisms of the same/closely related species in an area.
o Organisms need resources from abiotic AND biotic parts of an ecosystem to survive & reproduce.
o As resources are finite, different species & individuals will compete for them.
• Plants compete for water & mineral ions, light & space
• Animals compete for food, mates & territory
o Intraspecific competition occurs between members of the same species.
o Interspecific competition is where different species compete for the same resource at the same trophic level.
o Abiotic factors include physical factors such as: light intensity, CO2 levels (for plants), O2 levels (for aquatic animals),
water/moisture levels, soil pH + mineral content, temperature & wind intensity + direction.
o Biotic factors affect a community in terms of: availability of food, new predators arriving, new pathogens & one species
outcompeting another so that numbers aren’t sufficient enough to breed → leading to extinction.
o There’s interdependence between species, meaning that one species may rely on another for different things such as seed
dispersal, shelter, pollination & food.
o A stable community is where all the species & environmental factors are balanced, and population sizes stay relatively
constant.
o Removing a species from an ecosystem makes it unstable because:
• There’s interdependence between different species meaning that they may rely on another for services such as food,
shelter, pollination, and seed dispersal
• Removing one species could remove a key predator/prey which either increases or reduces population sizes
4.7.2 – Organisation of Ecosystems
Population Dynamics
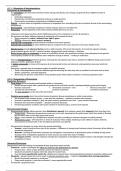
o Food chains show the feeding relationships within a community.
• Nearly always begins with a producer that produces its own food (usually a photosynthesising green plant/algae)
• Primary consumers – • Secondary consumers – eats • Tertiary consumers – eats
animals that eat producers primary consumers secondary consumers
• An apex predator is at the top of the food chain.
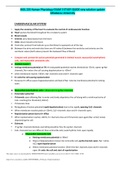
o Predator-prey graphs show the cyclical nature of predator & prey populations in stable communities.
• An increase in the number of prey = more food for predators → predator numbers also increase
• Increase in predator numbers = prey are eaten more by predators over time → prey numbers decrease
• Predators have less food available → predator numbers decrease
• Decreasing predator numbers allow prey numbers to increase again, and the cycle repeats
Environmental Changes
o Environmental change affects species, their distribution (spread) & (in extreme cases) their longevity (how long they live).
• Temperature – increasing temperatures cause sea ice to melt, meaning that the polar bears which hunt seals on floating
sea ice aren’t able to hunt their main food source.
• Water – some animals (eg. Wildebeests) migrate annually according to seasonal changes in rainfall patterns.
• Atmospheric gases – CO2 dissolves in water & increases water acidity, hindering corals’ ability to build a skeleton,
meaning that increased CO2 in the atmosphere prevents coral growth.
o Environmental changes can come about for reasons including:
• Seasons – many countries have rainy & dry seasons + difference in temperature between winter & summer drives birds on
worldwide migrations.
• Humans – burning of fossil fuels increases the atmospheric concentration of greenhouse gases, building of large dams
changes water availability & pollution of water sources can make them toxic to wildlife.
• Geological activity – volcanic eruptions change the composition of atmospheric gases & storms and droughts change the
availability of water.
Assessing Ecosystems
Experimental tools for looking at ecosystems & their population sizes include:
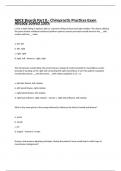
o Transects – used to investigate the effect of a factor on the distribution of a species.
• Transect line – piece of tape stretched across the habitat of interest.
• Quadrats are placed at regular intervals along the transect line.
• Can get more reproducible results by: adding more transect lines, decreasing distance between quadrats/adding more.
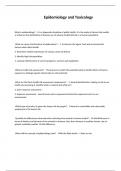
o Quadrats – square frames that can be used to estimate population sizes → works for immobile/slow moving populations.
• Should be placed randomly to avoid bias.
• Using more quadrats = more data collected = more reproducible result
o To estimate a population size:
Ecosystems & Communities
o An ecosystem is the interaction between biotic (living) and abiotic (non-living) components & has different levels of
organisation:
• Individual organisms
• Populations (of individual organisms make up a single species)
• Communities (consisting of populations of different species)
o Habitat – a place where an organism/community of organisms live, including all biotic and abiotic factors of the surrounding
environment.
o Environment – surroundings/conditions in which animals, plants or microbes live.
o Population – all the organisms of the same/closely related species in an area.
o Organisms need resources from abiotic AND biotic parts of an ecosystem to survive & reproduce.
o As resources are finite, different species & individuals will compete for them.
• Plants compete for water & mineral ions, light & space
• Animals compete for food, mates & territory
o Intraspecific competition occurs between members of the same species.
o Interspecific competition is where different species compete for the same resource at the same trophic level.
o Abiotic factors include physical factors such as: light intensity, CO2 levels (for plants), O2 levels (for aquatic animals),
water/moisture levels, soil pH + mineral content, temperature & wind intensity + direction.
o Biotic factors affect a community in terms of: availability of food, new predators arriving, new pathogens & one species
outcompeting another so that numbers aren’t sufficient enough to breed → leading to extinction.
o There’s interdependence between species, meaning that one species may rely on another for different things such as seed
dispersal, shelter, pollination & food.
o A stable community is where all the species & environmental factors are balanced, and population sizes stay relatively
constant.
o Removing a species from an ecosystem makes it unstable because:
• There’s interdependence between different species meaning that they may rely on another for services such as food,
shelter, pollination, and seed dispersal
• Removing one species could remove a key predator/prey which either increases or reduces population sizes
4.7.2 – Organisation of Ecosystems
Population Dynamics
o Food chains show the feeding relationships within a community.
• Nearly always begins with a producer that produces its own food (usually a photosynthesising green plant/algae)
• Primary consumers – • Secondary consumers – eats • Tertiary consumers – eats
animals that eat producers primary consumers secondary consumers
• An apex predator is at the top of the food chain.
o Predator-prey graphs show the cyclical nature of predator & prey populations in stable communities.
• An increase in the number of prey = more food for predators → predator numbers also increase
• Increase in predator numbers = prey are eaten more by predators over time → prey numbers decrease
• Predators have less food available → predator numbers decrease
• Decreasing predator numbers allow prey numbers to increase again, and the cycle repeats
Environmental Changes
o Environmental change affects species, their distribution (spread) & (in extreme cases) their longevity (how long they live).
• Temperature – increasing temperatures cause sea ice to melt, meaning that the polar bears which hunt seals on floating
sea ice aren’t able to hunt their main food source.
• Water – some animals (eg. Wildebeests) migrate annually according to seasonal changes in rainfall patterns.
• Atmospheric gases – CO2 dissolves in water & increases water acidity, hindering corals’ ability to build a skeleton,
meaning that increased CO2 in the atmosphere prevents coral growth.
o Environmental changes can come about for reasons including:
• Seasons – many countries have rainy & dry seasons + difference in temperature between winter & summer drives birds on
worldwide migrations.
• Humans – burning of fossil fuels increases the atmospheric concentration of greenhouse gases, building of large dams
changes water availability & pollution of water sources can make them toxic to wildlife.
• Geological activity – volcanic eruptions change the composition of atmospheric gases & storms and droughts change the
availability of water.
Assessing Ecosystems
Experimental tools for looking at ecosystems & their population sizes include:
o Transects – used to investigate the effect of a factor on the distribution of a species.
• Transect line – piece of tape stretched across the habitat of interest.
• Quadrats are placed at regular intervals along the transect line.
• Can get more reproducible results by: adding more transect lines, decreasing distance between quadrats/adding more.
o Quadrats – square frames that can be used to estimate population sizes → works for immobile/slow moving populations.
• Should be placed randomly to avoid bias.
• Using more quadrats = more data collected = more reproducible result
o To estimate a population size: