Data collection
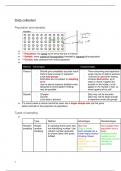
Population and samples
●
● ***Population: the whole set of items that are of interest
● ***Sample: some subset of the population intended to represent the population
● ***Census: data collected from entire population
●
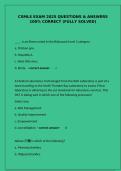
Method Advantages Disadvantages
Census - Should give completely accurate result - Time-consuming and expensive
- Data is large enough to represent - Large volume of data to process
small sub-groups - *Cannot be used when testing
- Estimates are not subject to sampling involves destruction, eg in
error order to check if apples are
- (due to above reasons) detailed cross- mouldy on the inside, cut all
tabulations (trend-/pattern-finding) apples in the market in half, no
may be possible whole apples left to sell!
Sample - Cheaper - Data may not be accurate
- Quicker - Data may not be large enough
- Less data to process to represent small sub-groups
● If in some cases a census cannot be used, use a larger sample size (as this gives
better estimate of the proportion of population)
Types of sampling
●
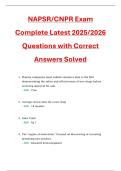
Type Method Advantages Disadvantages
Random Simple In sampling frame each item Bias-free Not suitable when
sampling random has identifying number. Use Easy & cheap population size is
sampling random number generator Each sample has a large
to choose items until quota known equal chance Sampling frame
fulfilled of being chosen needed (ie not
Without having list of every
replacement, each member of
selection population)
independent of each
other
1
, Systematic 𝑝𝑜𝑝𝑢𝑙𝑎𝑡𝑖𝑜𝑛 𝑠𝑖𝑧𝑒 (𝑁) Simple & quick to Sampling frame
k= . Use
sampling 𝑠𝑎𝑚𝑝𝑙𝑒 𝑠𝑖𝑧𝑒 (𝑛) use again needed
random number generator Suitable for large Can introduce bias
to choose number 𝜆 samples/populations if sampling frame
between 1 and k, then NOT random (ie k
sample every 𝜆th element, ie is non-random)
required elements are
chosen at regular intervals
in ordered list
Stratified Population divided into Reflects population Population must
sampling groups (strata) and a simple structure be classified
random sample carried out Guarantees clearly into distinct
in each group. proportional strata
𝑔𝑟𝑜𝑢𝑝 𝑠𝑖𝑧𝑒 × 𝑠𝑎𝑚𝑝𝑙𝑒 𝑠𝑖𝑧𝑒 (𝑛) representation of Selection within
𝑝𝑜𝑝𝑢𝑙𝑎𝑡𝑖𝑜𝑛 𝑠𝑖𝑧𝑒 (𝑁) groups within each stratum
sampled from each strata; population suffers from same
used when sample is large disadvantages as
and population naturally simple random
divides into groups sampling
Non- Quota Population naturally divided No sampling frame Introduce bias
random sampling into groups according to needed Might be
sampling (non-random characteristics. Still be inaccurate
version of 𝑔𝑟𝑜𝑢𝑝 𝑠𝑖𝑧𝑒 × 𝑠𝑎𝑚𝑝𝑙𝑒 𝑠𝑖𝑧𝑒 (𝑛) representative of Will need to
stratified) 𝑝𝑜𝑝𝑢𝑙𝑎𝑡𝑖𝑜𝑛 𝑠𝑖𝑧𝑒 (𝑁) whole population increase scope of
sampled from each strata Quick, easy, study
— interviewer collects inexpensive Non-responses
whatever sampling units Easy comparison not included
come at them until quota Impossible to
fulfilled (ie if one group has estimate sampling
reached its quota and more errors
of its sampling units show
up, disregard)
Opportunity Sample taken from people Easy Bias
sampling who are available at time of Inexpensive Highly dependent
study No sampling frame on researcher
individual
○ ***Random sampling: each item has equal chance of being chosen to avoid
bias
● Simple random sampling
Q: There are 64 girls and 56 boys in a school. Explain briefly how you could take a
random sample of 15 pupils using a simple random sample. (3)
A:
1. Allocate each pupil to a number
2. Use random number generator to select 15 different numbers
3. Pupils corresponding to these numbers become the sample
● Systematic sampling
Q: A telephone directory contains 50000 names. A researcher wants to select a
systematic sample of 100 names from the directory. Explain in detail how the
researcher should obtain such a sample. (2)
A:
2
, 1. k = = 500, then choose number k between 1 & 500 using random
number generator
2. Take every kth person
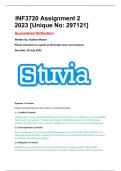
● Stratified sampling
Q:
A:
1. Total no. of students: 15 x 30 + 150 = 600
2. Then take random sample of = 15, 15 x 2 = 30 (2 from each class);
40 - 30 = 10, 10 from sixth form
3. Label the boys 1-15 and girls 1-15
4. Use random number generator to select 1 boy & 1 girl (from each class)
5. Label boys in sixth form 1-75
` girls ``` `-`
6. Random number generator generates 10 numbers between 1 and 75
7. Pick 5 people from each gender group
● Quota sampling
Q:
A:
(a) Sampling frame of fish impossible to obtain
(b) Quota sampling
(c) Advantage: samples can be obtained quickly, disadvantage: impossible to
estimate sampling errors (as no sampling frame)
(d) Total fish = 1400 + 600 + 450 = 2450, collect a number of each species of fish in
proportion to each group size.
x 30 ≈ 17 trout, x 30 ≈ 7 bass, x 30 ≈ 6 pike
Fish are caught from the lake until the quota are reached
Types of data
● Qualitative - non-numerical values
3
, ● Quantitative - numerical values
○ Discrete - integer values (discontinuous)
○ Continuous - numbers in ANY range
Measurement of location and spread
● ***Measures of location: single values describing a position in a data set
○ ***Measures of central tendency: centre of data, ie a notion of “average”
● ***Measures of spread: how data is spread out/how spread out the data is
Measures of location:
Measures of aximum Measures of spread:
central Interquartil
tendency: inimum e range
M
uartiles (四分位
數)
●
● Advantages & disadvantages of measures of central tendency and spread:
Measure Advantages Disadvantages
Mean Reflects all the data Can be affected by extreme values
Median Not usually affected by extreme Not all data is used
values/outliers/errors
Mode Can be used for qualitative data Not all data is used
Not usually affected by extreme Not representative if other values have
values/outliers/errors similar frequencies/if total frequency is
small
Range Reflects all the data Can be affected by extreme values
Interquartile Not usually affected by extreme Not all data is used
range values
Interpercentile Not usually affected by extreme Not all data is used
range values
Uses more of the data than IQR
Variance Uses all data Doesn’t have the same units as data set
(∵ variance = standard deviation,
squared)
Can be affected by extreme values
Standard Uses all data Can be affected by extreme values
deviation Has the same units as data set
●
4
Population and samples
●
● ***Population: the whole set of items that are of interest
● ***Sample: some subset of the population intended to represent the population
● ***Census: data collected from entire population
●
Method Advantages Disadvantages
Census - Should give completely accurate result - Time-consuming and expensive
- Data is large enough to represent - Large volume of data to process
small sub-groups - *Cannot be used when testing
- Estimates are not subject to sampling involves destruction, eg in
error order to check if apples are
- (due to above reasons) detailed cross- mouldy on the inside, cut all
tabulations (trend-/pattern-finding) apples in the market in half, no
may be possible whole apples left to sell!
Sample - Cheaper - Data may not be accurate
- Quicker - Data may not be large enough
- Less data to process to represent small sub-groups
● If in some cases a census cannot be used, use a larger sample size (as this gives
better estimate of the proportion of population)
Types of sampling
●
Type Method Advantages Disadvantages
Random Simple In sampling frame each item Bias-free Not suitable when
sampling random has identifying number. Use Easy & cheap population size is
sampling random number generator Each sample has a large
to choose items until quota known equal chance Sampling frame
fulfilled of being chosen needed (ie not
Without having list of every
replacement, each member of
selection population)
independent of each
other
1
, Systematic 𝑝𝑜𝑝𝑢𝑙𝑎𝑡𝑖𝑜𝑛 𝑠𝑖𝑧𝑒 (𝑁) Simple & quick to Sampling frame
k= . Use
sampling 𝑠𝑎𝑚𝑝𝑙𝑒 𝑠𝑖𝑧𝑒 (𝑛) use again needed
random number generator Suitable for large Can introduce bias
to choose number 𝜆 samples/populations if sampling frame
between 1 and k, then NOT random (ie k
sample every 𝜆th element, ie is non-random)
required elements are
chosen at regular intervals
in ordered list
Stratified Population divided into Reflects population Population must
sampling groups (strata) and a simple structure be classified
random sample carried out Guarantees clearly into distinct
in each group. proportional strata
𝑔𝑟𝑜𝑢𝑝 𝑠𝑖𝑧𝑒 × 𝑠𝑎𝑚𝑝𝑙𝑒 𝑠𝑖𝑧𝑒 (𝑛) representation of Selection within
𝑝𝑜𝑝𝑢𝑙𝑎𝑡𝑖𝑜𝑛 𝑠𝑖𝑧𝑒 (𝑁) groups within each stratum
sampled from each strata; population suffers from same
used when sample is large disadvantages as
and population naturally simple random
divides into groups sampling
Non- Quota Population naturally divided No sampling frame Introduce bias
random sampling into groups according to needed Might be
sampling (non-random characteristics. Still be inaccurate
version of 𝑔𝑟𝑜𝑢𝑝 𝑠𝑖𝑧𝑒 × 𝑠𝑎𝑚𝑝𝑙𝑒 𝑠𝑖𝑧𝑒 (𝑛) representative of Will need to
stratified) 𝑝𝑜𝑝𝑢𝑙𝑎𝑡𝑖𝑜𝑛 𝑠𝑖𝑧𝑒 (𝑁) whole population increase scope of
sampled from each strata Quick, easy, study
— interviewer collects inexpensive Non-responses
whatever sampling units Easy comparison not included
come at them until quota Impossible to
fulfilled (ie if one group has estimate sampling
reached its quota and more errors
of its sampling units show
up, disregard)
Opportunity Sample taken from people Easy Bias
sampling who are available at time of Inexpensive Highly dependent
study No sampling frame on researcher
individual
○ ***Random sampling: each item has equal chance of being chosen to avoid
bias
● Simple random sampling
Q: There are 64 girls and 56 boys in a school. Explain briefly how you could take a
random sample of 15 pupils using a simple random sample. (3)
A:
1. Allocate each pupil to a number
2. Use random number generator to select 15 different numbers
3. Pupils corresponding to these numbers become the sample
● Systematic sampling
Q: A telephone directory contains 50000 names. A researcher wants to select a
systematic sample of 100 names from the directory. Explain in detail how the
researcher should obtain such a sample. (2)
A:
2
, 1. k = = 500, then choose number k between 1 & 500 using random
number generator
2. Take every kth person
● Stratified sampling
Q:
A:
1. Total no. of students: 15 x 30 + 150 = 600
2. Then take random sample of = 15, 15 x 2 = 30 (2 from each class);
40 - 30 = 10, 10 from sixth form
3. Label the boys 1-15 and girls 1-15
4. Use random number generator to select 1 boy & 1 girl (from each class)
5. Label boys in sixth form 1-75
` girls ``` `-`
6. Random number generator generates 10 numbers between 1 and 75
7. Pick 5 people from each gender group
● Quota sampling
Q:
A:
(a) Sampling frame of fish impossible to obtain
(b) Quota sampling
(c) Advantage: samples can be obtained quickly, disadvantage: impossible to
estimate sampling errors (as no sampling frame)
(d) Total fish = 1400 + 600 + 450 = 2450, collect a number of each species of fish in
proportion to each group size.
x 30 ≈ 17 trout, x 30 ≈ 7 bass, x 30 ≈ 6 pike
Fish are caught from the lake until the quota are reached
Types of data
● Qualitative - non-numerical values
3
, ● Quantitative - numerical values
○ Discrete - integer values (discontinuous)
○ Continuous - numbers in ANY range
Measurement of location and spread
● ***Measures of location: single values describing a position in a data set
○ ***Measures of central tendency: centre of data, ie a notion of “average”
● ***Measures of spread: how data is spread out/how spread out the data is
Measures of location:
Measures of aximum Measures of spread:
central Interquartil
tendency: inimum e range
M
uartiles (四分位
數)
●
● Advantages & disadvantages of measures of central tendency and spread:
Measure Advantages Disadvantages
Mean Reflects all the data Can be affected by extreme values
Median Not usually affected by extreme Not all data is used
values/outliers/errors
Mode Can be used for qualitative data Not all data is used
Not usually affected by extreme Not representative if other values have
values/outliers/errors similar frequencies/if total frequency is
small
Range Reflects all the data Can be affected by extreme values
Interquartile Not usually affected by extreme Not all data is used
range values
Interpercentile Not usually affected by extreme Not all data is used
range values
Uses more of the data than IQR
Variance Uses all data Doesn’t have the same units as data set
(∵ variance = standard deviation,
squared)
Can be affected by extreme values
Standard Uses all data Can be affected by extreme values
deviation Has the same units as data set
●
4